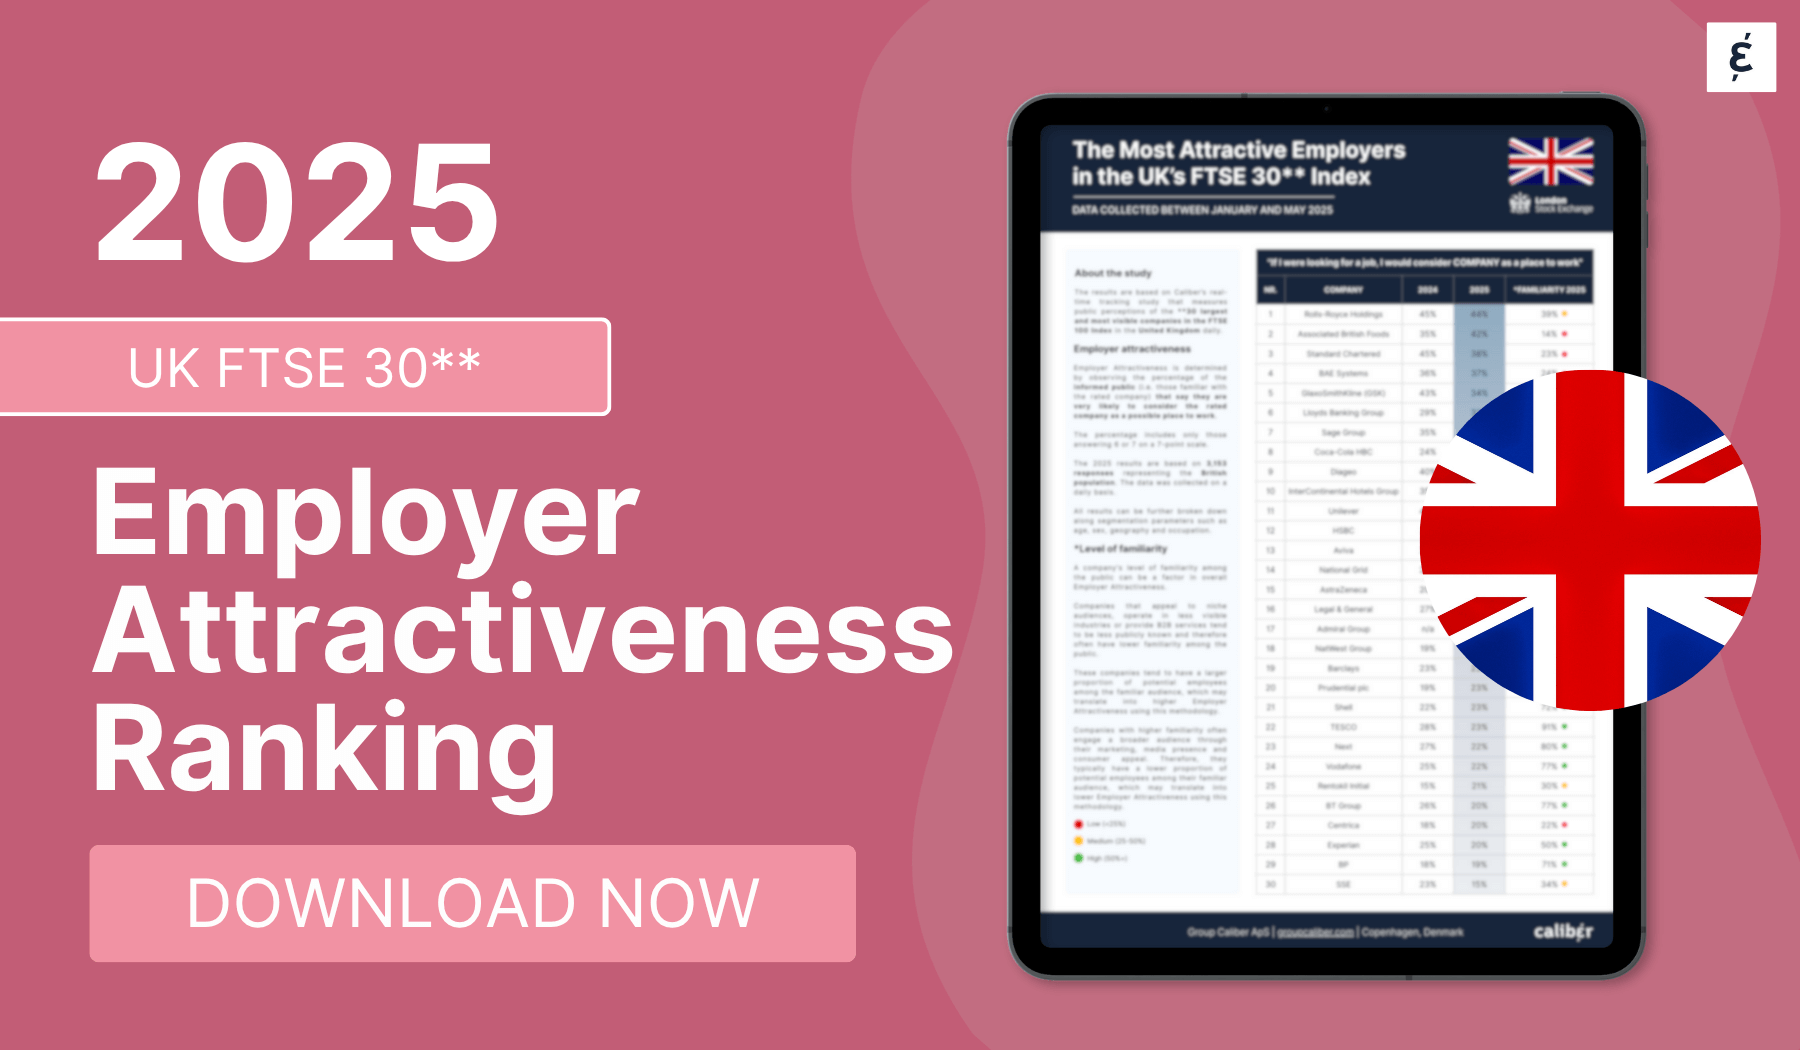
The most attractive employers among the UK FTSE 30*
Rolls-Royce is the most attractive employer among the *30 largest and most visible FTSE 100 companies Caliber tracks daily, at 45% for 2026. Scores improved across much of the index over the past year.
Three takeaways from the 2026 FTSE Top 30 employer attractiveness scores
01
Rolls-Royce is the most attractive UK FTSE Top 30 employer in 2026 at 45%, the highest score in the index.
02
Improvement was broad among well-known names, with Experian (+11), Tesco (+6) and GSK (+6) all climbing.
03
Energy and utility employers climbed sharply, with SSE (+11), Centrica (+9) and National Grid (+6) all rising.
The UK FTSE Top 30 — 2026 Employer Attractiveness Ranking
Employer Attractiveness is determined by observing the percentage of the informedpublic (i.e. those familiar with the rated company) that say they are very likely to consider the rated company as a possible place to work. The percentage includes only those answering 6 or 7 on a 7-point scale.
Nr.↕
Company↕
2025↕
2026↕
Change↕
Familiarity↕
1
Rolls-Royce Holdings
44%
45%
+1
38%
2
Standard Chartered
38%
43%
+5
25%
3
BAE Systems
37%
43%
+6
24%
4
Associated British Foods
42%
40%
-2
17%
5
GlaxoSmithKline (GSK)
34%
40%
+6
30%
6
Coca-Cola HBC
31%
37%
+6
47%
7
National Grid
27%
33%
+6
48%
8
Diageo
31%
32%
+1
17%
9
Sage Group
33%
32%
-1
27%
10
Experian
20%
31%
+11
47%
11
Unilever
29%
29%
—
50%
12
Centrica
20%
29%
+9
19%
13
Lloyds Banking Group
33%
29%
-4
72%
14
AstraZeneca
26%
29%
+3
45%
15
TESCO
23%
29%
+6
91%
16
Admiral Group
24%
28%
+4
51%
17
InterContinental Hotels Group
30%
28%
-2
29%
18
Next
22%
27%
+5
73%
19
Prudential plc
23%
26%
+3
39%
20
Shell
23%
26%
+3
68%
21
SSE
15%
26%
+11
29%
22
Legal & General
25%
25%
—
50%
23
Aviva
27%
24%
-3
63%
24
NatWest Group
24%
24%
—
59%
25
Barclays
23%
24%
+1
80%
26
BT Group
20%
23%
+3
77%
27
HSBC
28%
23%
-5
69%
28
Rentokil Initial
21%
22%
+1
25%
29
Vodafone
22%
21%
-1
72%
30
BP
19%
17%
-2
68%
METHODOLOGY
How the ranking is built
Employer Attractiveness is the percentage of the informed public, who say they would consider that company as a place to work.
Respondents rate the statement “If I were looking for a job, I would consider [company] as a place to work” on a 7-point scale from strongly disagree to strongly agree.The score is the share who answer 6 or 7, the two highest levels of agreement.
The 2026 results are based on 8,090 responses representative of the UK population, collected daily between January and July 2026 through Caliber’s real-time tracking study. Results can be broken down by age, sex, geography, and occupation.
Why familiarity matters
Familiarity shapes how an Employer Attractiveness score should be read, because the score only counts people who already know the company.
Companies that serve niche audiences, operate in less visible industries, or provide B2B services tend to be less widely known. The people who do know them are more likely to be potential employees, which can lift Employer Attractiveness under this methodology.
Highly familiar companies reach a much broader audience through marketing, media presence, and consumer appeal. A smaller share of that audience are potential employees, which can pull scores in the other direction.
Go beyond the ranking
Explore your Employer Attractiveness score by segment and geography, and take a closer look at your overall reputation across the dozens of attributes Caliber’s Stakeholder Intelligence Platform tracks every day.