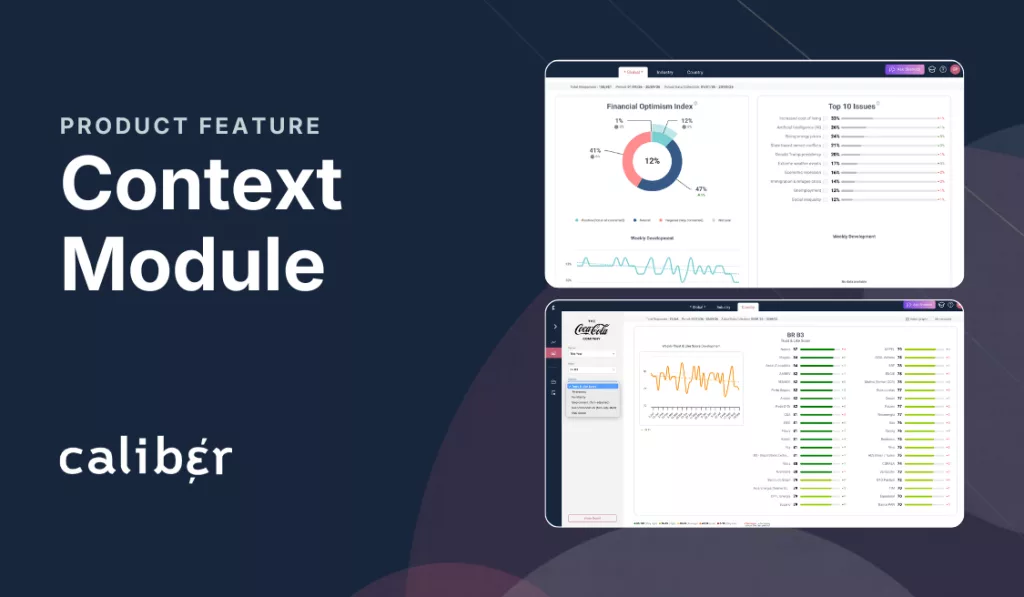
Caliber’s Context module puts every reputation score in its global context. It shows the issues on the public’s mind, how people feel about their financial future, and how 14 industries and the largest companies in each market are performing, so you can see whether a change is about your company or the world around it.
No company’s reputation moves in isolation. Cost of living worries, energy prices, conflicts, and debates about AI shape how people feel about business in general, and about some industries in particular. When a reputation score rises or falls, the first question leadership asks is whether the change is about the company or about everything happening around it.
Answering that question takes global context. This guide explains why reputation needs global context, what Caliber’s Context module shows in each of its three views, and how to use it step by step. It includes real examples from Caliber’s 2026 data and shows how communications, brand, HR, and public affairs teams use global context in their work.
Why does reputation need global context?
Reputation needs global context because outside events, the economic mood, and industry trends move perception across whole markets at once. Without global context, a company can mistake a market-wide shift for its own problem, or miss that it’s outperforming a difficult environment.
How do world events move perception of every company?
World events shape how people see companies across the board. When public concern about energy prices, conflict, or new technology rises, perception of whole sectors shifts with it, often regardless of what any single company does.
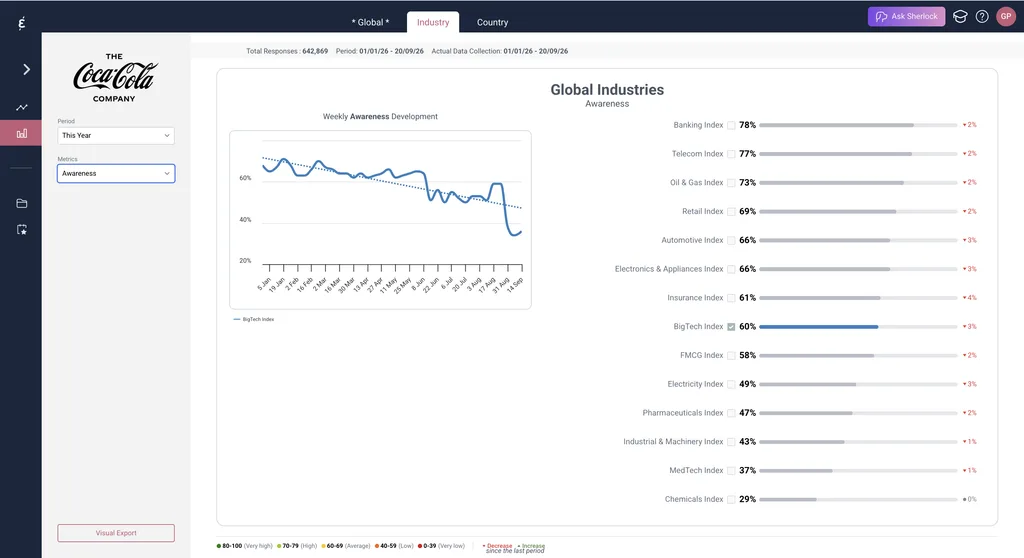
The effect shows up clearly in Caliber’s data. In the first nine months of 2026, 13 of the 14 industry indices in Caliber’s Context module recorded lower awareness than in the previous period of the same length. A company that saw its awareness dip over that time wasn’t necessarily doing anything wrong. Global context shows whether a change is shared with the rest of the market.
Why does the economic mood matter for reputation?
The economic mood colors how people judge companies. When people are worried about their own finances, they tend to scrutinize prices, value, and corporate behavior more closely, and sectors such as banking, energy, and retail feel it first.
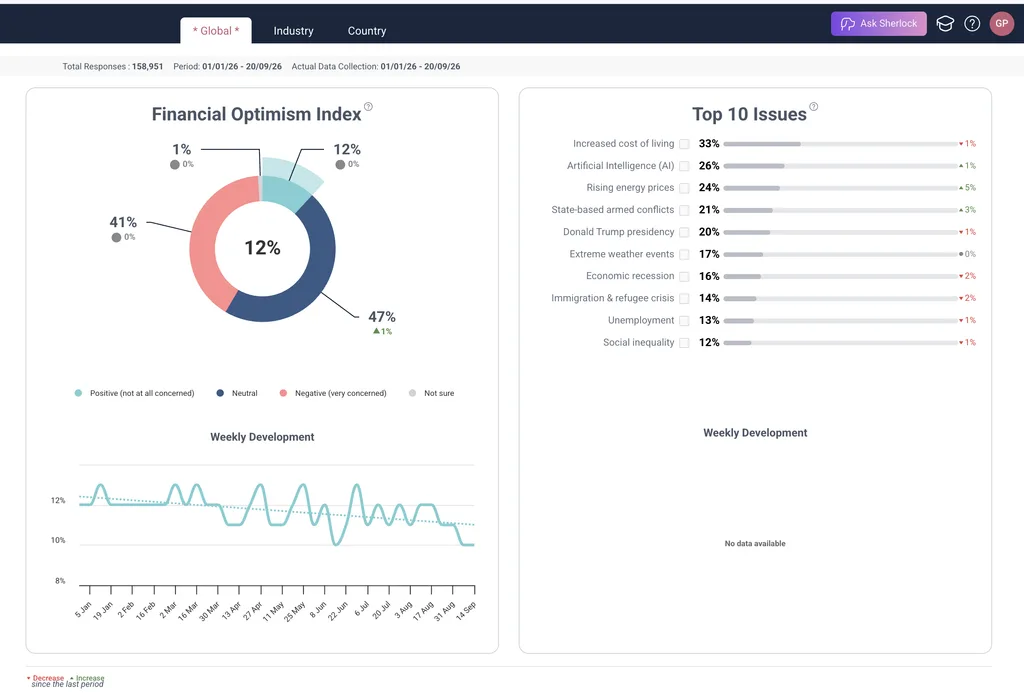
Caliber measures that mood directly. Across the Caliber Global 7 markets in the first nine months of 2026, 41% of people said they were very concerned about their future financial situation, and only 12% said they were not at all concerned. That’s the global context every company’s results sat in this year.
Why can the same score mean different things in different sectors?
Every sector starts from a different baseline. In Caliber’s data for the first nine months of 2026, awareness of the Banking and Telecom industry indices stood at 78% and 77%, while the MedTech index sat at 37% and the Chemicals index at 29%. A chemical company with 40% awareness is doing well for its sector, while a bank with the same figure has a visibility problem.
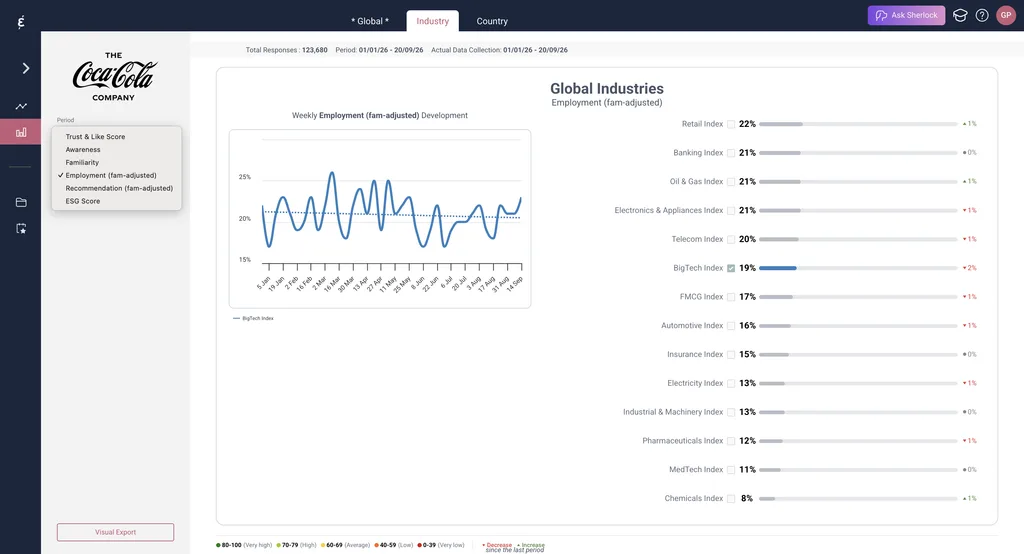
Employer appeal varies just as much. Over the same period, 22% of people familiar with the Retail index companies said they would consider working for them, compared with 8% for the Chemicals index. Industry context shows which gaps belong to the sector and which belong to your company.
Why can’t you compare scores across countries directly?
People in different countries answer surveys differently, so raw scores can’t be compared across markets. Some cultures rate companies generously and others hold back, regardless of how they actually feel. Caliber reports raw scores and benchmarks locally, which is why its country indices matter: they give every company a reference point in its own market. Our guide to benchmarking against competitors explains this in more detail.
What is Caliber’s Context module?
Caliber’s Context module is the part of the platform that puts your results in their global context, using data from Caliber’s syndicated tracking. It shows the public mood, industry trends, and country rankings in three views, Global, Industry, and Country, so every result can be read against the world around it.
The Context module sits in Stakeholder 360, next to your own tracking and your competitor benchmarks. Your own data shows how stakeholders see you. The Context module shows what’s happening around you.
What are the three views?
The three views move from the broadest global context to the most local:
- Global: what’s on the public’s mind, through the Financial Optimism Index and the Top 10 Issues people expect to affect society.
- Industry: how 14 global industry indices compare, and how each is developing over time.
- Country: how the largest companies in a country index rank, with the option to add your own company.
Which metrics can you compare?
The Industry and Country views let you choose from six metrics:
- Trust & Like Score: Caliber’s headline measure of how much people trust and like a company, scored from 0 to 100.
- Awareness: the share of people who have heard of the companies in an index.
- Familiarity: the share who know the companies well enough to form a view.
- Employment (fam-adjusted): the share of people familiar with the companies who would consider working for them.
- Recommendation (fam-adjusted): the share of people familiar with the companies who would recommend them.
- ESG Score: how people rate the companies on environmental, social, and governance performance.
The two familiarity-adjusted metrics compare companies on the views of people who actually know them. That keeps comparisons fair between well-known consumer brands and less visible business-to-business companies.
What data is the Context module based on?
The Context module draws on Caliber’s syndicated tracking, the same continuous data behind Caliber’s public Trust & Like Score rankings. The Global view and the industry indices cover the Caliber Global 7 markets: Brazil, China, France, Germany, Japan, the UK, and the US. Since June 2026, the Global view also covers every country a client tracks or has tracked.
Every view shows how much data sits behind it. The top of each screen lists the total number of responses, the selected period, and the actual dates of data collection. The Industry view for awareness in 2026 so far, for example, draws on more than 640,000 responses.
How does the Context module work?
The Context module works by letting you pick a view, a metric, and a period, then compare rankings and trends. Every index and issue shows its change since the previous period, any of them can be plotted week by week, and scores are color-coded on Caliber’s Normative Scale, so global context is readable at a glance.
What does the Global view show?
The Global view shows the public mood behind every result, through two measures.
The Financial Optimism Index shows how concerned people are about their future financial situation. Across the Caliber Global 7 in the first nine months of 2026, 12% said they were not at all concerned, 47% were neutral, and 41% were very concerned. A weekly chart tracks how the optimistic share develops over time.
The Top 10 Issues ranking shows which topics people think will most affect society in the next 12 months. Over the same period, the increased cost of living led at 33%, followed by artificial intelligence at 26% and rising energy prices at 24%. Rising energy prices also showed the biggest increase, up five points on the previous period. Tick any issue to follow its development week by week.
Both measures can be filtered by period and country, so you can read the global context for the markets that matter most to you.
What does the Industry view show?
The Industry view ranks the 14 global industry indices on the metric you choose: Automotive, Banking, BigTech, Chemicals, Electricity, Electronics and Appliances, FMCG, Industrial and Machinery, Insurance, MedTech, Oil and Gas, Pharmaceuticals, Retail, and Telecom. Next to each score, a marker shows whether the index rose or fell since the previous period.
Tick any index to plot it on the weekly development chart, complete with a trend line. That shows whether a change is a one-off dip or part of a longer shift, and whether your own sector is moving with the wider global context or against it.
What does the Country view show?
The Country view ranks the companies in a country index, with a weekly development chart for the index as a whole. You choose the index from a menu, including Germany’s DAX 40, France’s CAC 40, Denmark’s OMX C25, Switzerland’s SMI 20, and Caliber’s selections of the largest and most visible companies in markets such as Brazil, the UK, and the US.
Scores appear as bars colored on the Normative Scale, from Very Low to Very High, with a marker for the change since the previous period. In the Brazil view for 2026 so far, company scores range from 87 at the top of the index to 70 at the bottom, which shows how wide the spread is even among a country’s best-known companies.
Two toggles sit above the ranking. “Index (graph)” plots the index average on the chart, and “My company” adds your own company to a supported index you track, so you appear in the ranking alongside the largest companies in your market, measured the same way.
How do you use global context, step by step?
- Spot the change in your own data. Start with a movement in your results, such as a drop in TLS or a rise in awareness among a key audience.
- Read the public mood. Open the Global view to see whether a rising issue, such as energy prices or AI, or a shift in financial optimism lines up with the change.
- Check your industry. Open the Industry view with the same metric and period, and plot your sector’s index on the weekly chart to compare timing.
- Check your country ranking. Open the Country view for your market and switch on “My company” to see where you stand among the largest local companies.
- Ask Sherlock. Sherlock, Caliber’s AI assistant, can reference Context data when explaining changes in your results.
- Report with global context attached. Use Visual Export to add the charts to management reports, so every result is presented alongside the world around it.
Does global context explain why your score changed?
Global context shows whether your score moved with the public mood, your sector, or your market. It doesn’t prove what caused the change. If your TLS and your industry index fell in the same weeks while concern about a related issue rose, a shared cause is likely, but your own data, your activities, and media coverage still need to be checked.
The strongest reading combines global context with a record of what your company did. Logging events and campaigns in My Activities, as described in our guide to PR measurement, puts both on the same timeline.
What does global context look like in practice?
In practice, global context changes how a company reads its own results. The public mood can explain why a whole industry moved at once, a sector benchmark can show that a weak-looking score is normal for the industry, and a country ranking gives a clear local reference point.
What does the 2026 public mood tell companies?
The 2026 data shows a public under financial pressure. With 41% of people in the Caliber Global 7 very concerned about their financial future, and the cost of living the top issue at 33%, companies are being judged by people who are watching prices, value, and fairness closely.
The issues list also points to the sectors under most scrutiny. Rising energy prices climbed five points in the first nine months of 2026, which makes global context especially relevant for energy, oil and gas, and electricity companies reading their own results. AI ranked as the second biggest issue, which matters for BigTech and for any company building AI into its products. Our analysis of whether AI is really shaping corporate reputation looks at that question in more depth.
How does industry context change the read on a sector score?
Caliber’s global automotive report found the sector’s TLS had fallen to 66, in the Average band and the lowest among the consumer-facing sectors Caliber tracks. For a carmaker, a TLS in the mid-60s is close to the sector norm. The industry context shifts attention from the headline number to the gap between the company and its closest competitors.
How does a country ranking give a local reference point?
Country rankings show how a company compares with the best-known companies where it operates. In Caliber’s 2026 US ranking of the 30 largest and most visible Fortune 500 companies, Costco leads with a TLS of 79, in the High band. Any US company tracking its own reputation can place itself against that reference point with the “My company” toggle.
How do teams benefit from global context?
Teams benefit from global context because it turns isolated numbers into a story leadership can act on. Corporate communications, brand and marketing, HR, and public affairs teams each use the Context module to explain results, set fair targets, and plan ahead.
How do corporate communications teams use it?
Corporate communications teams use global context to report results with the full picture attached. A two-point drop means something different when the whole industry index fell three points in the same quarter, or when financial concern spiked, and the Context module shows both immediately.
Global context also makes targets fairer. Setting KPIs relative to the sector and the public mood keeps the focus on what the communications team can influence, and away from market-wide swings it can’t control.
How do brand and marketing teams use it?
Brand and marketing teams use the Top 10 Issues to plan messaging that fits the moment. Knowing which topics matter most to the public, and which are rising, shows where a campaign is likely to land and where it risks sounding out of touch.
Industry context helps with targets too. A business-to-business company in a low-awareness sector can set awareness and familiarity goals that reflect its category, rather than comparing itself with consumer brands.
How do HR teams use it?
HR teams use the Employment metric in the Industry and Country views to benchmark their employer appeal. Because the metric is adjusted for familiarity, it shows how many people who know each company would consider working there, which keeps comparisons fair across sectors.
The spread between sectors matters when competing for talent across industries, and the economic mood shapes what candidates look for in an employer. A chemicals company scoring above its sector’s 8% is doing well, even if it trails a retail company. For dedicated employer brand tracking, Talent 360 and Caliber’s employer brand tracker go deeper.
How do public affairs and ESG teams use it?
Public affairs and ESG teams use the Top 10 Issues to see which societal topics are gaining attention, from energy prices to extreme weather and social inequality. The ESG Score in the Industry and Country views shows how their sector is rated on environmental, social, and governance performance.
Together, they help teams anticipate scrutiny before it arrives. Caliber’s ESG perception tracker adds company-level detail on how stakeholders see your ESG performance.
How can Caliber put your reputation in global context?
Caliber puts your reputation in global context with continuous, syndicated tracking of the public mood, 14 global industries, and the largest companies in each market. The Context module in Stakeholder 360 shows whether a change in your results is about you, your sector, or the world.
Every reputation result raises the same question: is this about us? Answering it takes global context, collected continuously and measured the same way as your own tracking, so the two can be read side by side.
Stakeholder 360 is built for this work. The Context module provides:
- The Financial Optimism Index and Top 10 Issues for the public mood, with weekly development
- 14 global industry indices, ranked and tracked week by week
- Country indices with a “My company” toggle to add yourself
- Six metrics, from TLS to familiarity-adjusted Employment and Recommendation
- Scores colored on the Normative Scale, with change since the previous period
- Sherlock, which can reference Context data when explaining your results
- Visual Export for management reports
For a wider view of reputation measurement, read our guide to how to measure brand reputation, explore Caliber’s work by sector, or see the latest insights.
Book a demo to see your results in their global context.