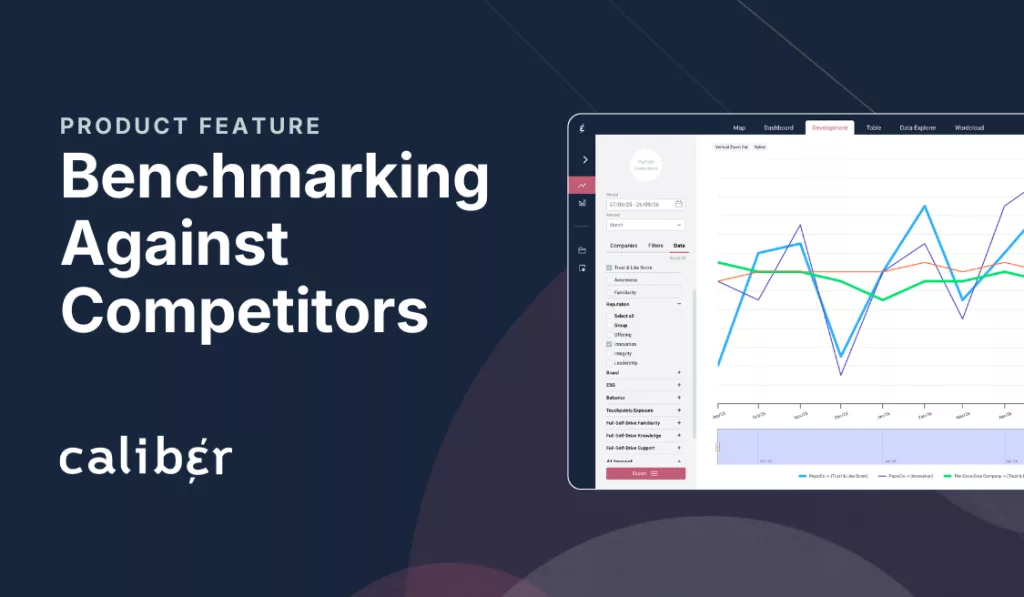
Caliber makes benchmarking against competitors part of everyday reputation tracking. You compare your Trust & Like Score, awareness, and behavioral intent with the competitors you choose, then check the result against industry indices, country indices, and the wider public mood in Caliber’s Context module.
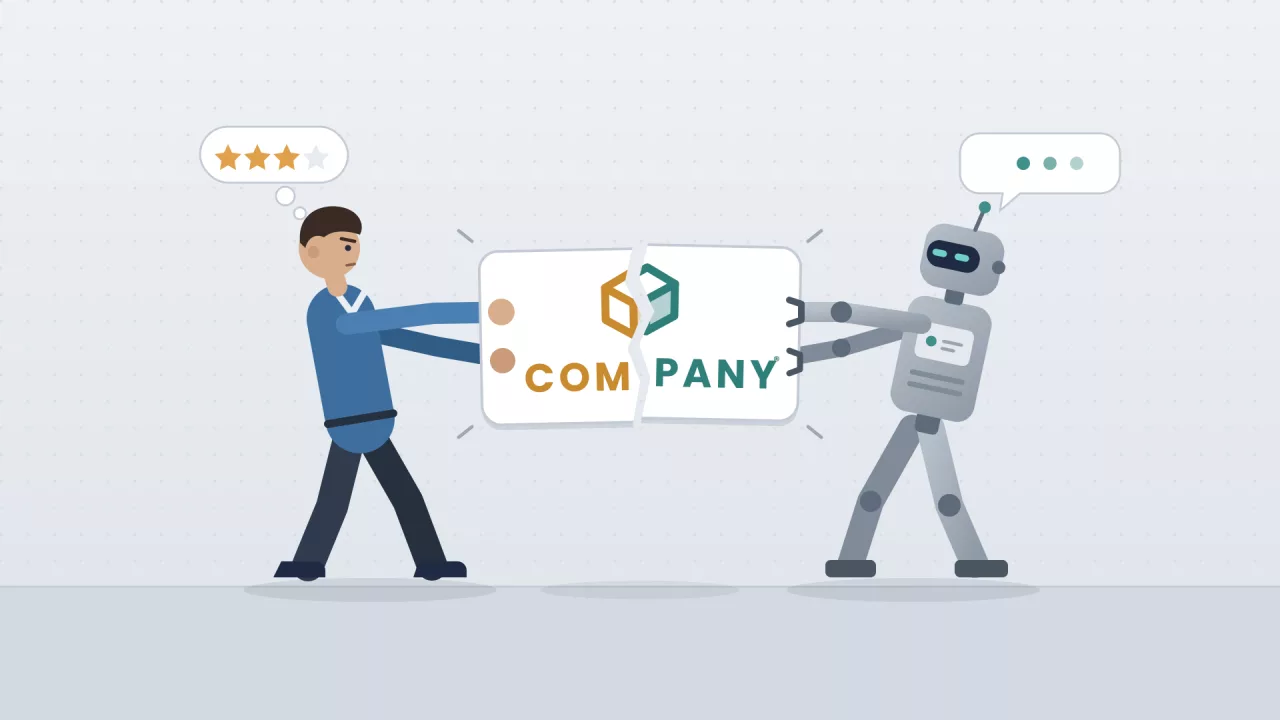
A reputation score on its own answers very little. Without a reference point, nobody can tell whether a score of 68 is strong, or whether a two-point drop is a company problem or a slip across the whole sector.
Benchmarking against competitors gives the score its meaning. This guide explains what to benchmark against, which metrics to compare, and why scores from different countries need care. It then shows how competitor benchmarks and the Context module work in Caliber, step by step, with examples from Caliber’s data and clients.
What is benchmarking against competitors, and why is it so hard to get right?
Benchmarking against competitors means comparing how stakeholders perceive your company with how they perceive your peers, on the same metrics, among the same audiences, over the same period. It’s hard to get right because the comparison only holds when all three match, and most reputation data isn’t collected that way.
Why does a reputation score mean little on its own?
A score tells you where you stand in absolute terms. Caliber’s Trust & Like Score (TLS) runs from 0 to 100 and is classified on the Normative Scale, from Very Low to Very High. A TLS of 72 sits in the High band, which is a good result in isolation.
The same 72 looks different next to your peers. If your closest competitor scores 78 among the buyers you both target, you’re behind where it matters most. Benchmarking against competitors adds that relative view, and it’s the relative view that shapes decisions about positioning, messaging, and investment.
Comparability matters as much as the numbers. A competitor figure from a different survey, a different question, or a different month can’t be set against yours with any confidence. Useful benchmarking against competitors needs every company measured with the same questions and the same method, continuously.
What should you benchmark against?
Four reference points each answer a different question:
- Direct competitors: how you compare with the companies your stakeholders actually weigh you against.
- Your industry: whether your score reflects your own performance or the general standing of your sector.
- Your country market: how you rank among the largest and most visible companies where you operate.
- Your own past: whether you’re improving, and how quickly compared with everyone else.
The strongest benchmarking combines all four. A company can be improving on its own past, holding steady against its sector, and still losing ground to one fast-moving competitor.
Which metrics and attributes should you compare?
You can compare competitors on any attribute that matters to your business, from Caliber’s standard model to attributes built around your own strategy. Every company in your benchmark is measured on the same questions, so each comparison is like for like.
The standard model covers the full path from awareness to behavior:
- Trust & Like Score: the headline measure of how much stakeholders trust and like each company.
- Awareness and familiarity: whether people know of each company, and whether they know enough to form a view.
- Brand attributes: Authenticity, Differentiation, Relevance, and Inspiration.
- Reputation attributes: Offering, Innovation, Integrity, and Leadership.
- ESG attributes: Environment, Society, and Governance.
- Behavioral intent: advocacy, consideration, recommendation, and interest in working for each company.
Custom attributes take the benchmark further. They let you compare competitors on the perceptions that are critical to your strategy, such as a purpose-driven positioning, a sustainability commitment, safety, or a specific product promise. Airbus, for example, added questions on its purpose-driven strategy to Caliber’s standard model and tracks them for itself and five competitors.
Attributes explain the headline gaps. If a competitor leads on TLS, the attribute scores usually show why, for example a clear lead on Innovation or Relevance. That points you to the perceptions where the gap can be closed, and to the attributes where you already lead and can build on your advantage.
Why can’t you compare scores across countries directly?
People in different countries answer surveys differently. In some cultures respondents rate companies generously, and in others they hold back, regardless of how they actually feel. A German company scoring lower among German respondents than a Brazilian company among Brazilian respondents says little about which company is better regarded.
Caliber doesn’t adjust scores to compensate. It reports raw scores, because adjusting them would penalize cultures for how they express feedback. Caliber’s guiding principle is to embrace variation, benchmark locally, and interpret in context. In practice, that means benchmarking against competitors within one country at a time, and using industry and country indices as the reference points.
For international single-company studies, Caliber also publishes a Cultural Adjustment Index. It estimates how far each country’s typical scores sit from the global average, so cross-country results can be read with the right caution.
What is Caliber’s Context module?
Caliber’s Context module puts your results into the wider market and societal picture, using data from Caliber’s syndicated tracking. It answers the question every benchmark raises: is this change about us, our industry, or the world?
The Context module sits in Stakeholder 360, alongside the competitor benchmarks in your own tracking. Competitor benchmarks show how you compare with the peers you’ve chosen. The Context module shows whether the pattern you see is bigger than you and your competitors, through three views:
- Industry view: 14 global industry indices, from Automotive and Banking to Pharmaceutical and Telecom.
- Country view: rankings of the largest companies in markets such as Germany, France, and the US, with a “My Company” toggle to add yourself.
- Global view: the public mood behind every benchmark, through the Financial Optimism Index and the Top 10 Issues people expect to affect society.
How does context change the way you read a benchmark?
Context shows whether a score is strong or weak for your sector and market. Caliber’s global automotive report found the sector’s TLS had fallen to 66, in the Average band and the lowest among the consumer-facing sectors Caliber tracks. For a carmaker, a TLS in the mid-60s is close to the sector norm, and the benchmark that matters is the gap to its closest competitors.
Country rankings work the same way. In Caliber’s 2026 US ranking of the 30 largest and most visible Fortune 500 companies, Costco leads with a TLS of 79, in the High band. Rankings like these, published across Caliber’s Trust & Like Score rankings, give every company a reference point in its own market.
How does benchmarking against competitors work in Caliber?
Benchmarking against competitors in Caliber starts with the peer set you track and ends with context. You choose your competitors and audience, read the gaps on the Perceptions dashboard, check them against industry and country indices, follow them over time, and confirm they’re statistically significant before you act.
What are the steps?
- Choose your competitor set. Track the companies your stakeholders actually compare you with. Airbus, for example, tracks itself and five competitors.
- Match the audience and the market. Use filters to compare the same stakeholder segment for every company, with AND and OR logic to build the exact audience you need. Compare within one country at a time.
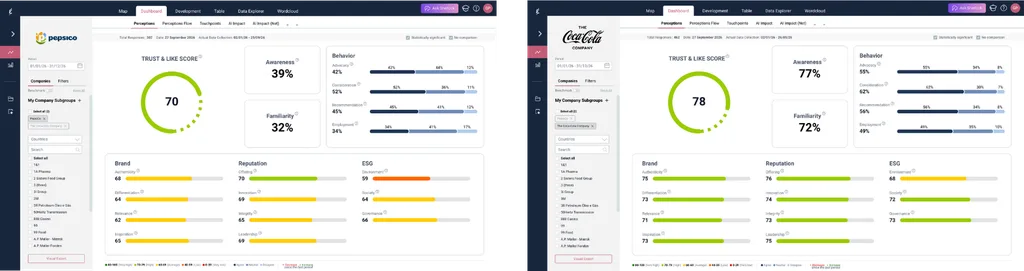
- Read the gaps. The Perceptions dashboard shows every key metric side by side, compared with the previous period and scored on the Normative Scale. When you compare several companies, the detailed breakdown of behavior answers shows for the first company in your selection.
- Add context. Open the Industry, Country, and Global views to see whether a gap reflects your company, your sector, or the wider mood.
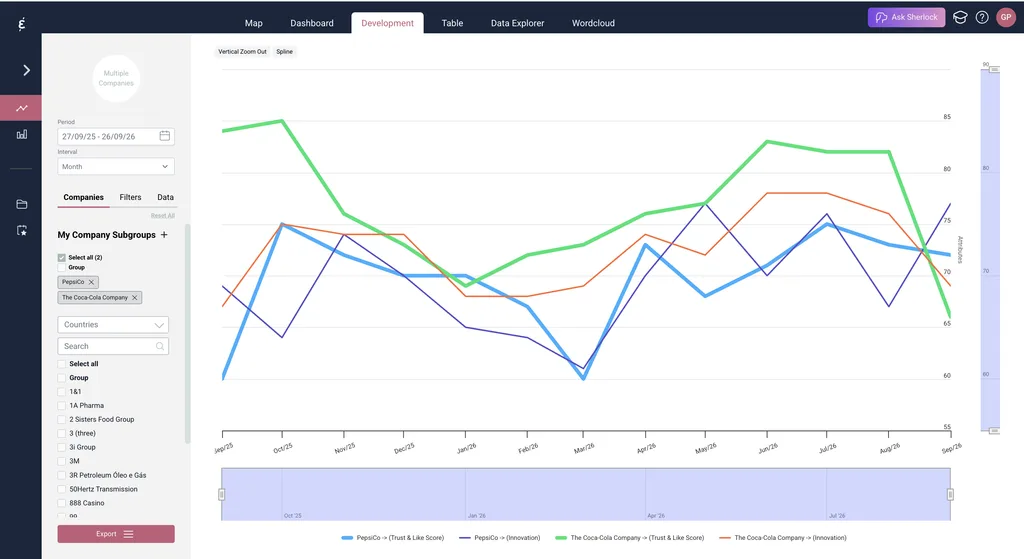
- Follow the gap over time. Use the Development view to track benchmarks by week, month, quarter, or year. Log your activities in My Activities to see what lines up with changes, as described in our guide to PR measurement.
- Check significance, then ask Sherlock. Confirm the gap clears the significance threshold for your sample size. Sherlock, Caliber’s AI assistant, can reference Context data to help explain whether a change is company-specific or sector-wide.
How do you read a benchmark on the Normative Scale?
Read every benchmark twice: once for the band, and once for the gap. The Normative Scale classifies scores into five bands: Very Low (0 to 39), Low (40 to 59), Average (60 to 69), High (70 to 79), and Very High (80 to 100).
The band tells you how stakeholders see a company in absolute terms. The gap tells you how you compare. Two competitors can both sit in the High band and still be six points apart, and if that gap is significant, it’s worth acting on.
What does it look like at a glance?
Here’s everything that goes into benchmarking against competitors in Caliber, from the views you can open to the rules that decide what counts as a real gap.
| Feature | How it works |
|---|---|
| Competitor benchmarks | Compare your company with the competitors you track, on every metric and for every audience |
| Industry view | 14 global industry indices, built from major companies across the Caliber Global 7 markets |
| Country view | Company rankings and trends in 14 country indices, with a My Company toggle to add yourself |
| Global view | Financial Optimism Index and Top 10 Issues, filterable by period and country |
| Metrics compared | Trust & Like ScoreAwarenessFamiliarityRecommendationEmploymentESG Score |
| Normative Scale | Very Low: 0 to 39Low: 40 to 59Average: 60 to 69High: 70 to 79Very High: 80 to 100 |
| Audiences | Configurable stakeholder segments, with AND and OR logic between filters |
| Development over time | Benchmarks tracked by week, month, quarter, or year |
| Sherlock | Can reference Context data to show whether a change is company-specific or sector-wide |
| Significance | Under 100: directional only100 to 199: 4+ points300 to 699: 2+ points700+: 1+ point |
| Coverage | 6M+ interviews3,000+ companies monitored50+ countries |
| Data quality | Panel partners meet ESOMAR standards |
What does benchmarking against competitors look like in practice?
In practice, benchmarking against competitors means tracking a fixed peer set continuously, in every market that matters, and using the gaps to plan. Airbus benchmarks itself against five competitors across 11 countries, and a global financial services company used five benchmark companies to understand its awareness market by market.
How does Airbus benchmark against five competitors?
Airbus tracks itself and five competitors daily across 11 countries. The setup uses custom filters for professionals, key opinion leaders, and talent in aerospace and defense, so every comparison is made among the audiences that matter to the business.
The teams use the data to compare performance against the benchmark, follow perceptions over time, and cross-reference them with media coverage and company activities. Results feed monthly management reports, quarterly and annual reviews with the Brand Committee, and annual KPIs for the communications and brand teams.
How did a global financial services company benchmark brand awareness?
A global financial services company needed to know how aware and familiar its target audiences were with the brand, compared with competitors. Caliber tracked the company against five benchmark companies, with separate B2B and B2C dashboards and segments based on profession, responsibility, and experience.
Over six months, the tracking covered 2,100 interviews. Market-specific questions showed how brand associations and campaign performance compared from one market to the next.
What do Caliber’s rankings show about industry and market benchmarks?
Caliber’s public rankings are benchmarks in their own right. The 2026 Trust & Like Score rankings show how the largest companies in each market compare, and industry reports show where a sector sits as a whole.
They’re a useful first reference point for any company planning its own benchmarking against competitors. Your sector page shows how Caliber works with companies in your industry.
How do communications teams benefit from the Context module?
Communications teams benefit from the Context module because it turns benchmarking against competitors into a clear story: where you stand, whether a change is yours or the sector’s, and what to do next. Corporate communications, brand and marketing, and regional teams each use that story differently.
How do corporate communications teams use it?
Corporate communications teams use the Context module to report to leadership with context attached. A two-point drop means something different when the whole industry index fell three points in the same quarter, and the Industry view shows that immediately.
It also makes KPIs fairer and more useful. Setting targets relative to competitors and the sector keeps the focus on what the team can influence.
How do brand and marketing teams use it?
Brand and marketing teams use competitor benchmarks to find where they stand out and where they fall behind. Attribute scores show which perceptions separate you from each competitor, such as Innovation, Relevance, or Authenticity.
For a deep dive into one specific audience compared with competitors, Caliber Focus adds a focused study alongside continuous tracking.
How do regional and market teams use it?
Regional teams use the Country view to see how they rank among the largest companies in their own market, and the My Company toggle puts them in that ranking directly. Local competitor benchmarks show whether a market moved on its own or with its peers.
Because scores aren’t compared across countries, each market team gets a fair benchmark on its own terms.
How can Caliber support your benchmarking against competitors?
Caliber supports benchmarking against competitors with continuous tracking of your company and your peers, using the same questions and methodology for every company, plus industry and country context from its syndicated data. Stakeholder 360 and the Context module show where you stand, why, and whether it’s changing.
Good benchmarking against competitors answers the question leadership asks after every result: compared with whom? Answering it takes like-for-like data on your company and your peers, collected continuously, among the audiences that matter, with the market context to read it correctly.
Stakeholder 360 is built for this work. It provides:
- Continuous tracking of your company and the competitors you choose, on the same questions and methodology
- 14 global industry indices and country indices in the Context module
- The Financial Optimism Index and Top 10 Issues, for the public mood behind every benchmark
- Scores classified on the Normative Scale, with built-in significance rules
- Audience filters with AND and OR logic, so every comparison is like for like
- Sherlock, which can reference Context data to help explain what’s driving a change
For a wider view of reputation metrics, read our guide to how to measure brand reputation, or see how Caliber’s customers use their data.
Book a demo to see how your company compares with your competitors.