There’s ample proof that stakeholder behavior is linked to the degree to which people trust and like a company.
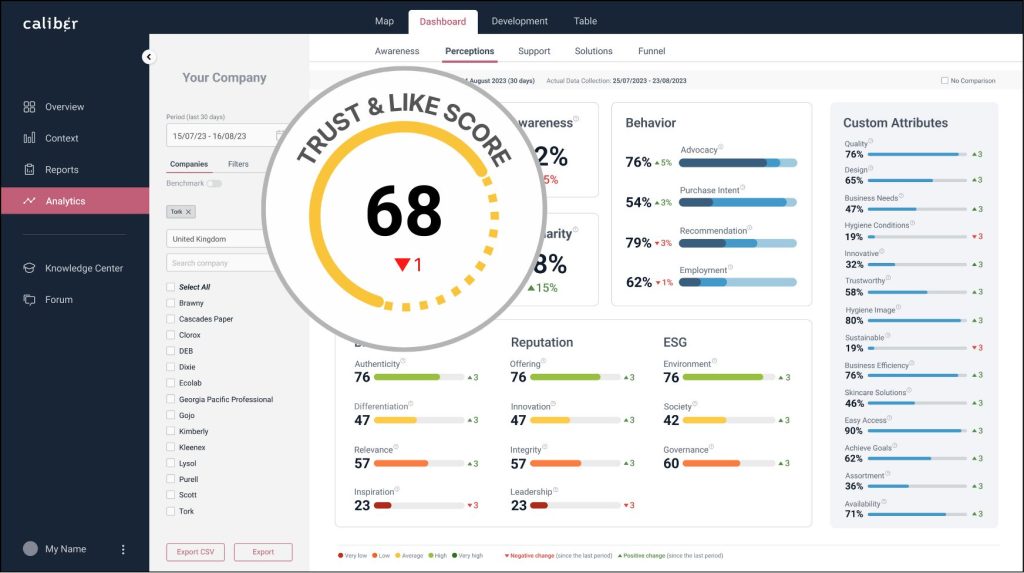
The Trust & Like Score is, therefore, the chief element we use to measure the strength of a company’s brand and reputation.
The rankings presented here are derived from Caliber’s real-time tracking study, which assesses the public perceptions of the 50 largest companies listed on the UK FTSE 100 index daily.
The study incorporates 7,427 responses, representing a diverse sample of the British population.
Submit the form below to download the ranking:
Most Trusted & Liked Companies in The United Kingdom — FTSE 50 Ranking, 2023
Rank ⇅
Company ⇅
TLS 2022 ⇅
TLS 2023 ⇅
+/- ⇅
1
RELX
75
74
▼ -1
2
TESCO
73
74
▲ +1
3
Ashtead Group
73
71
▼ -2
4
Flutter Entertainment
66
71
▲ +5
5
Haleon
70
71
▲ +1
6
Next
68
71
▲ +3
7
Coca-Cola HBC
n/a
70
n/a
8
Informa
70
70
— 0
9
Associated British Foods
67
69
▲ +2
10
CRH
74
69
▼ -5
11
InterContinental Hotels Group
70
69
▼ -1
12
Rolls-Royce Holdings
66
69
▲ +3
13
Segro
73
69
▼ -4
14
Experian
65
67
▲ +2
15
Reckitt
64
67
▲ +3
16
Smith & Nephew
67
67
— 0
17
Standard Chartered
63
67
▲ +4
18
Antofagasta
68
66
▼ -2
19
Sage Group
n/a
66
n/a
20
Scottish Mortgage Inv. Trust
73
66
▼ -7
21
3i Group
64
65
▲ +1
22
Aviva
66
65
▼ -1
23
Imperial Brands
66
65
▼ -1
24
Bunzl
65
64
▼ -1
25
GlaxoSmithKline (GSK)
64
64
— 0
26
Legal & General
63
64
▲ +1
27
London Stock Exchange Group
61
64
▲ +3
28
National Grid
65
64
▼ -1
29
Unilever
61
64
▲ +3
30
WPP
61
63
▲ +2
31
Barclays
62
62
— 0
32
Diageo
61
62
▲ +1
33
HSBC
59
62
▲ +3
34
Lloyds Banking Group
62
62
— 0
35
Prudential plc
62
62
— 0
36
Vodafone
56
62
▲ +6
37
BAE Systems
60
61
▲ +1
38
NatWest Group
59
61
▲ +2
39
AstraZeneca
65
60
▼ -5
40
BT Group
59
60
▲ +1
41
Compass Group
58
60
▲ +2
42
Glencore
58
60
▲ +2
43
Rentokil Initial
60
60
— 0
44
Anglo American
60
59
▼ -1
45
SSE
54
53
▼ -1
46
Shell
52
52
— 0
47
Rio Tinto
55
51
▼ -4
48
BP
50
50
— 0
49
Centrica
52
48
▼ -4
50
British American Tob. (BAT)
37
41
▲ +4
How to Read the Trust & Like Score
80–100 Very high70–79 High60–69 Average40–59 Low0–39 Very low
Trusted by leading global brands across 30+ markets
What is the Trust & Like Score (TLS)?
The Trust & Like Score (TLS) is Caliber’s core measure of stakeholder confidence. It combines two questions:
Trust: “Is this a company I trust?”
Likeability: “Is this a company I like?”
Together, these measures indicate which companies stakeholders are most likely to support and recommend—and which are better positioned to withstand scrutiny.
The TLS ranking is updated annually and is based on continuous measurement throughout the year, making it a stable benchmark rather than a one-off survey snapshot.
Want to understand why your score looks the way it does?
Caliber experts can help you go beyond the ranking to understand the “why”—by breaking results down by stakeholder groups, tracking changes over time, and identifying which reputation drivers are strengthening or weakening perceptions in your market.
Book a demo to see how we can help you:
Understand what drives shifts in trust and likeability
Benchmark against peers and track momentum over time
Analyse perceptions across stakeholder segments
Fill out the form below to talk to our stakeholder intelligence experts
Explore previous UK FTSE 30 Trust & Like Score Rankings