Every year, Caliber ranks the top companies in the US on corporate reputation: how much people trust them, like them, and want to work for them. These corporate reputation rankings come from Caliber’s Stakeholder Intelligence Platform, which surveys thousands of people in the US every day.
The Trust & Like Score ranking is published annually in the first quarter, and the Employer Attractiveness ranking follows in the third quarter.
The Trust & Like Score (TLS) is Caliber’s chief metric for measuring corporate reputation and stakeholder trust: how much the American public trusts and likes each company. Because it’s built on continuous daily tracking of a representative population rather than a single survey wave, TLS functions as a genuine benchmark of corporate reputation, not a one-off opinion poll.
The most trusted and liked companies in the US Fortune 30 in 2026
Companies are selected for this ranking as the 30 largest and most visible companies in the Fortune 500 Index, based on turnover, headcount, historical presence, and general public familiarity.
Every company in this ranking is measured through Caliber’s annual daily stakeholder study, using two direct questions: “[Company] is a company I trust” and “[Company] is a company I like.” The 2025 score is based on over 30,000 responses from the American population, collected daily throughout the year.
What is Caliber's Trust & Like Score?
Each answer is collected on a 7-point scale and normalized to Caliber’s 0-100 Normative Scale, making scores directly comparable across companies, across markets, and across years.
Because the underlying data is collected every day rather than once a year, a company’s TLS reflects how its reputation actually moved across the full 12 months, not a single moment when a survey happened to run, which is what makes it a reliable benchmark rather than a snapshot.
About the Familiarity Scores
Scores are based on evaluations from demographically representative respondents who demonstrated high familiarity with the company they rated, defined as scoring 4 or above on a 7-point familiarity scale, after demonstrating general awareness of it. Companies where fewer than 15% of respondents met this threshold are excluded from the main ranking
80–100 Very high70–79 High60–69 Average40–59 Low0–39 Very low
Top companies in the US by employer attractiveness
The Employer Attractiveness Score is Caliber’s chief metric for measuring how appealing a company is as a place to work in the US. Because it’s built on continuous daily tracking of a representative population rather than a single survey wave, it functions as a genuine benchmark of employer appeal, not a one-off opinion poll.
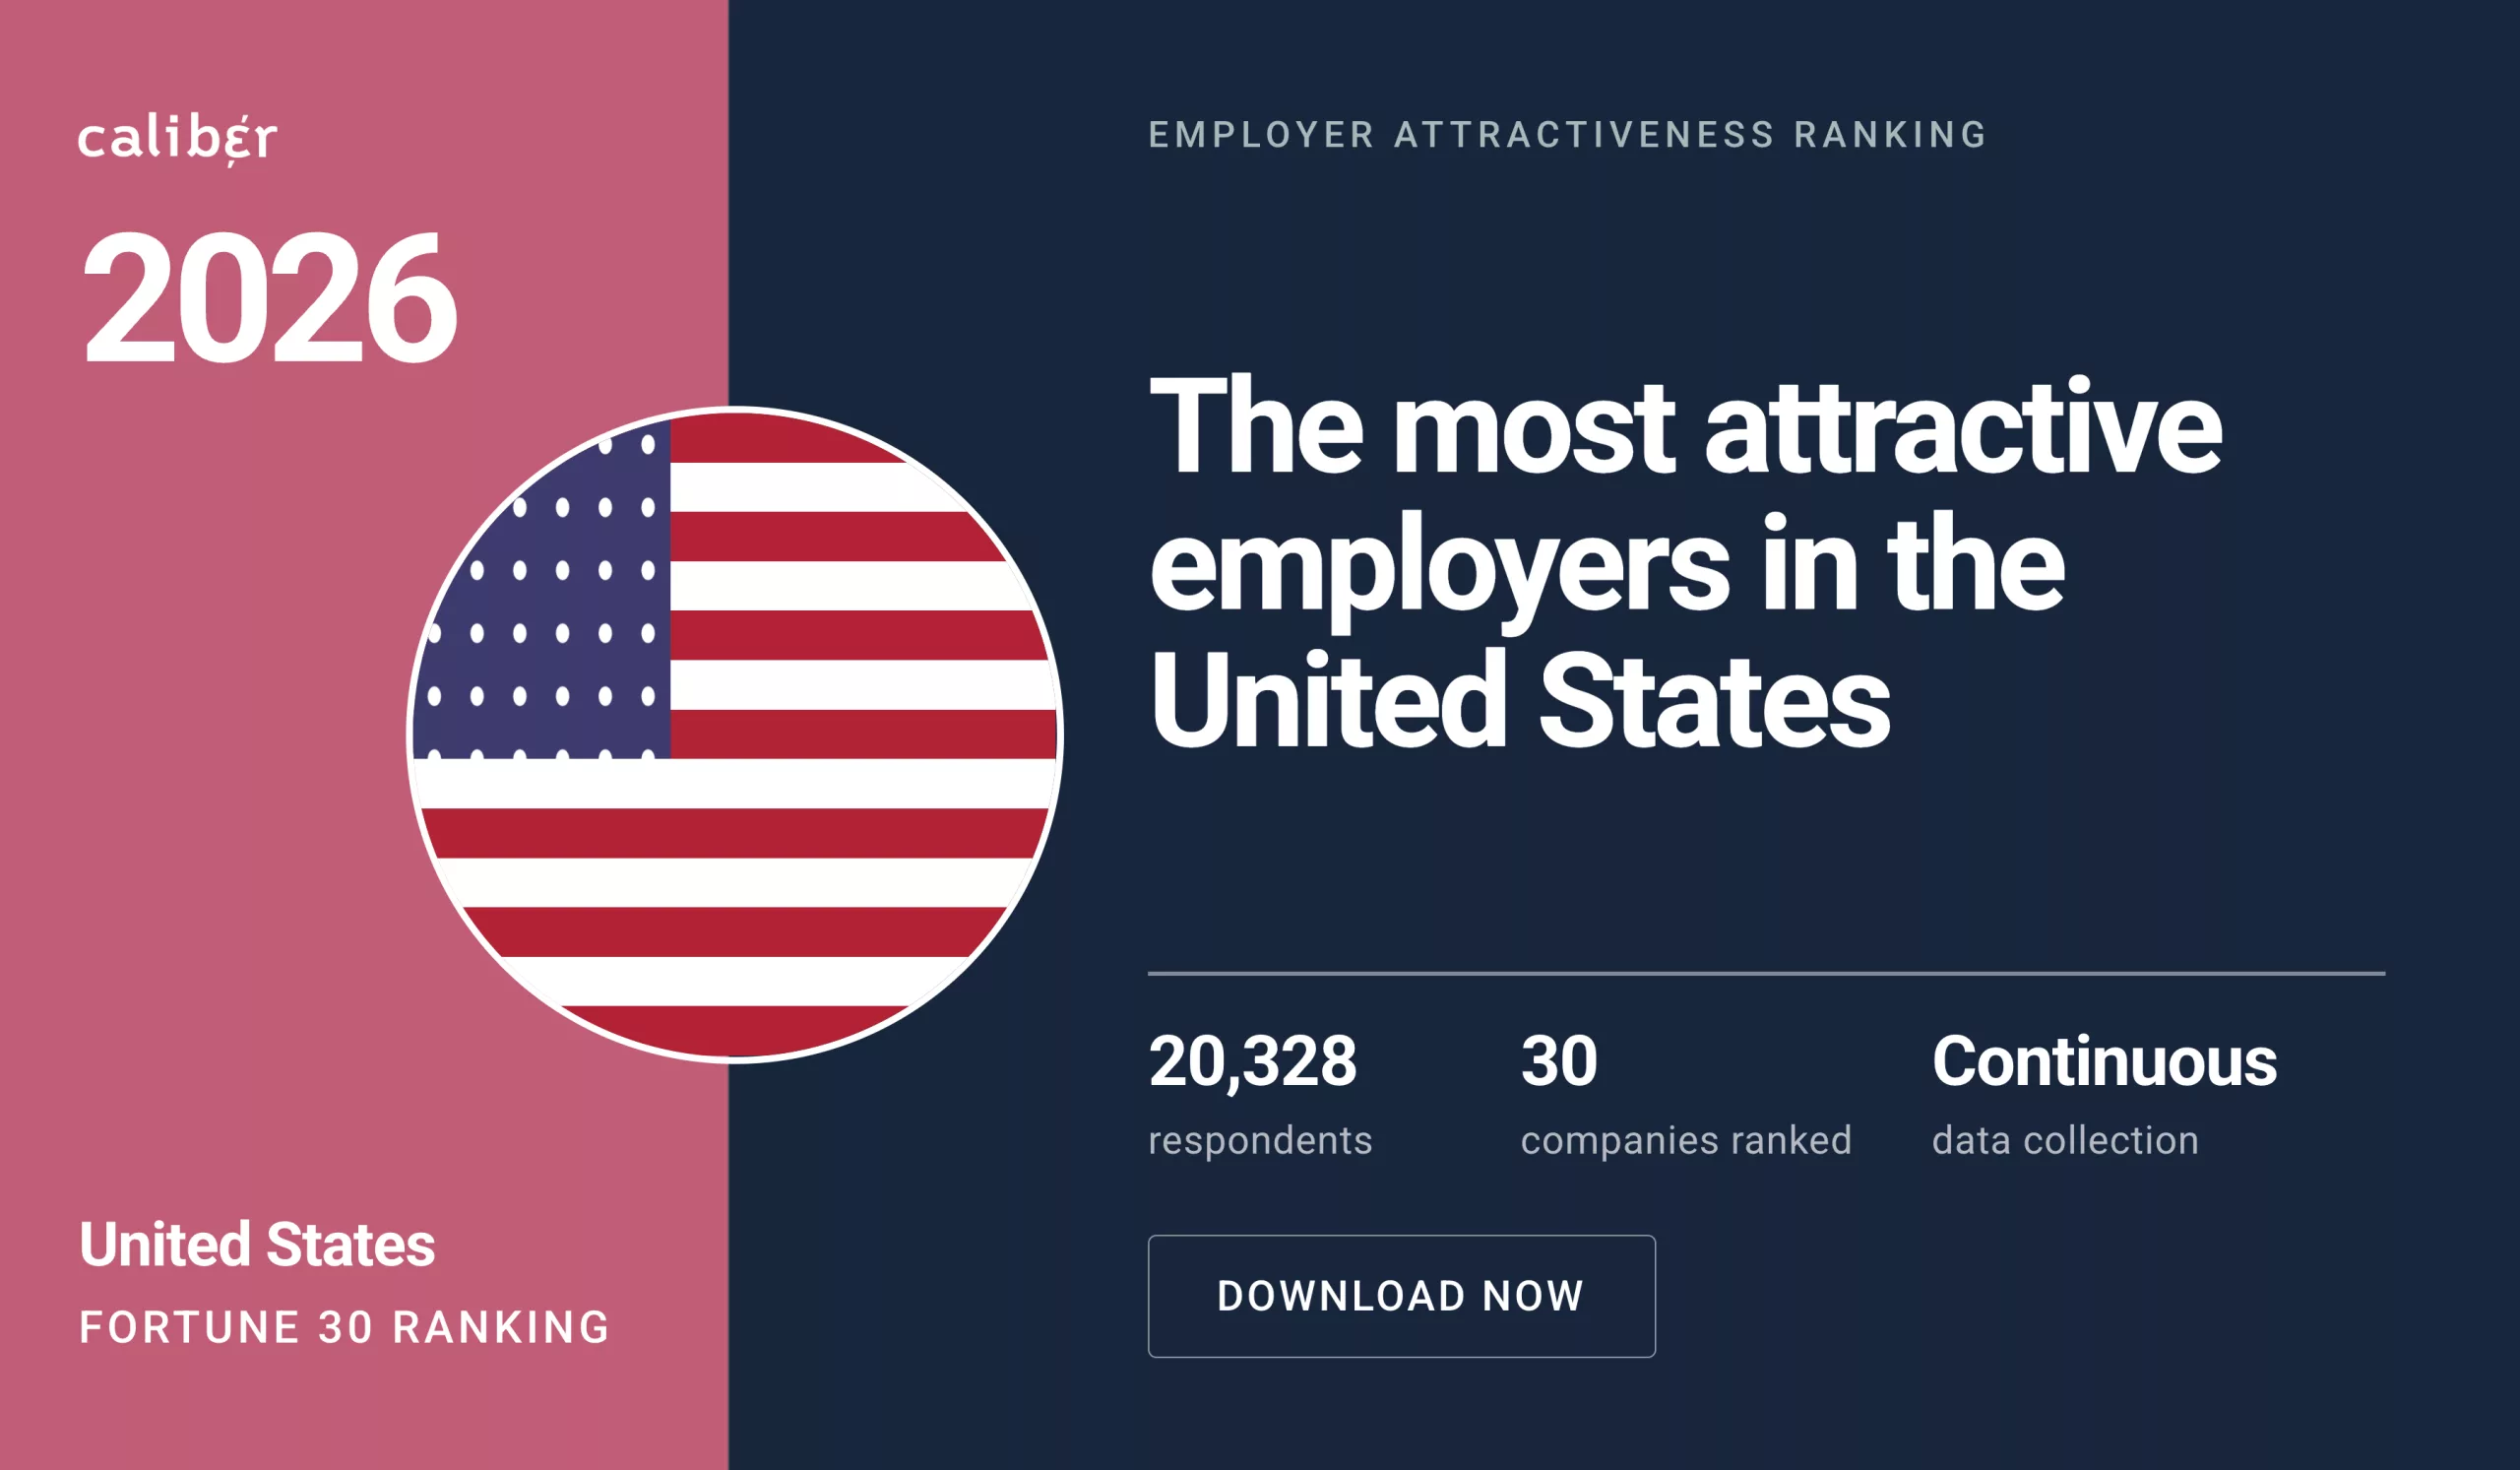
The most attractive employers in the US Fortune 30 in 2026
Companies are selected for this ranking as the 30 largest and most visible companies in the Fortune 500 Index, based on turnover, headcount, historical presence, and general public familiarity.
Every company in this ranking is measured through Caliber’s annual daily stakeholder study, using one direct question: “If I were looking for a job, I would consider [company] as a place to work.” The 2026 score is based on over 20,300 responses from the American population, collected daily between January and July 2026.
What is Caliber's Employer Attractiveness Score?
The score counts only the top two ratings, 6 and 7, on a 7-point scale, and only among respondents already familiar with the company, so it reflects genuine consideration rather than general name recognition.
Because the underlying data is collected daily across a defined survey window rather than from a single spontaneous poll, a company’s score reflects a consistent, representative read of the working American population, which is what makes it a reliable benchmark rather than a snapshot.
About the familiarity scores
Scores are based on evaluations from demographically representative respondents who demonstrated high familiarity with the company they rated, defined as scoring 4 or above on a 7-point familiarity scale, after demonstrating general awareness of it. Companies where fewer than 15% of respondents met this threshold are excluded from the main ranking.
How Caliber's Top Companies in the US Rankings Differ From Other Corporate Reputation Rankings
Most corporate reputation rankings share the same basic setup: a single survey, run once a year, asked only to consumers. Caliber’s rankings are built differently, in three ways that change what the score actually tells you.
A full year of data, not a snapshot
Caliber surveys people in the US every single day, all year long, so each score reflects a full year of continuous data, not one moment a single news cycle could skew.
Dozens of real audience segments
Scores break down by stakeholder group, age, income, political affiliation, and more, showing exactly which audiences drive a company’s reputation up or down, not just that it moved.
Predicts behavior, not just sentiment
The Trust & Like Score is validated across 40 markets and 4 million+ responses, so it links directly to buying, recommending, investing, and hiring intent, not just how people feel.
0M+
Interviews conducted so far, with thousands added every day
0+
Companies monitored worldwide, including largest players across all sectors
0+
Interviews conducted so far, with thousands added every day
METHODOLOGY
How Caliber Ranks the Top Companies in the US
Continuous, real-time data collection
Caliber surveys thousands of people daily on how they perceive each company tracked. Respondents are representative of the national population by age, gender, region, and other key demographics.
Familiarity and informed opinions
Only respondents who are aware of and familiar with a company are included in the scoring, so results reflect informed perceptions, not general awareness or brand recognition.
Reliable and comparable results
All results sit on a 0–100 scale, standardized using Caliber’s globally validated Normative Scale, with a margin of error of around ±1.6 points at a 95% confidence level, making every ranking robust and directly comparable.
Statistically validated reputation model
Each ranking is based on Caliber’s reputation framework, tested across 40 markets and over 5 million responses, showing how perceptions shape trust and likeability, which in turn drive buying, recommending, investing, and hiring decisions.
FAQs About the Top Companies in the United States
What are the top companies in the US?
Caliber ranks the top companies in the US using two Fortune 30 rankings: the Trust & Like Score, which measures overall corporate reputation, and the Employer Attractiveness Score, which measures appeal as a workplace. Costco leads the 2026 Trust & Like Score ranking, and Apple leads the 2025 Employer Attractiveness ranking.
Which company is the most trusted in the US?
Costco ranks first in Caliber’s 2026 US Fortune 30 Trust & Like Score ranking, with a score of 79, placing it in the High tier on Caliber’s 0-100 scale.
What are the best companies to work for in the US?
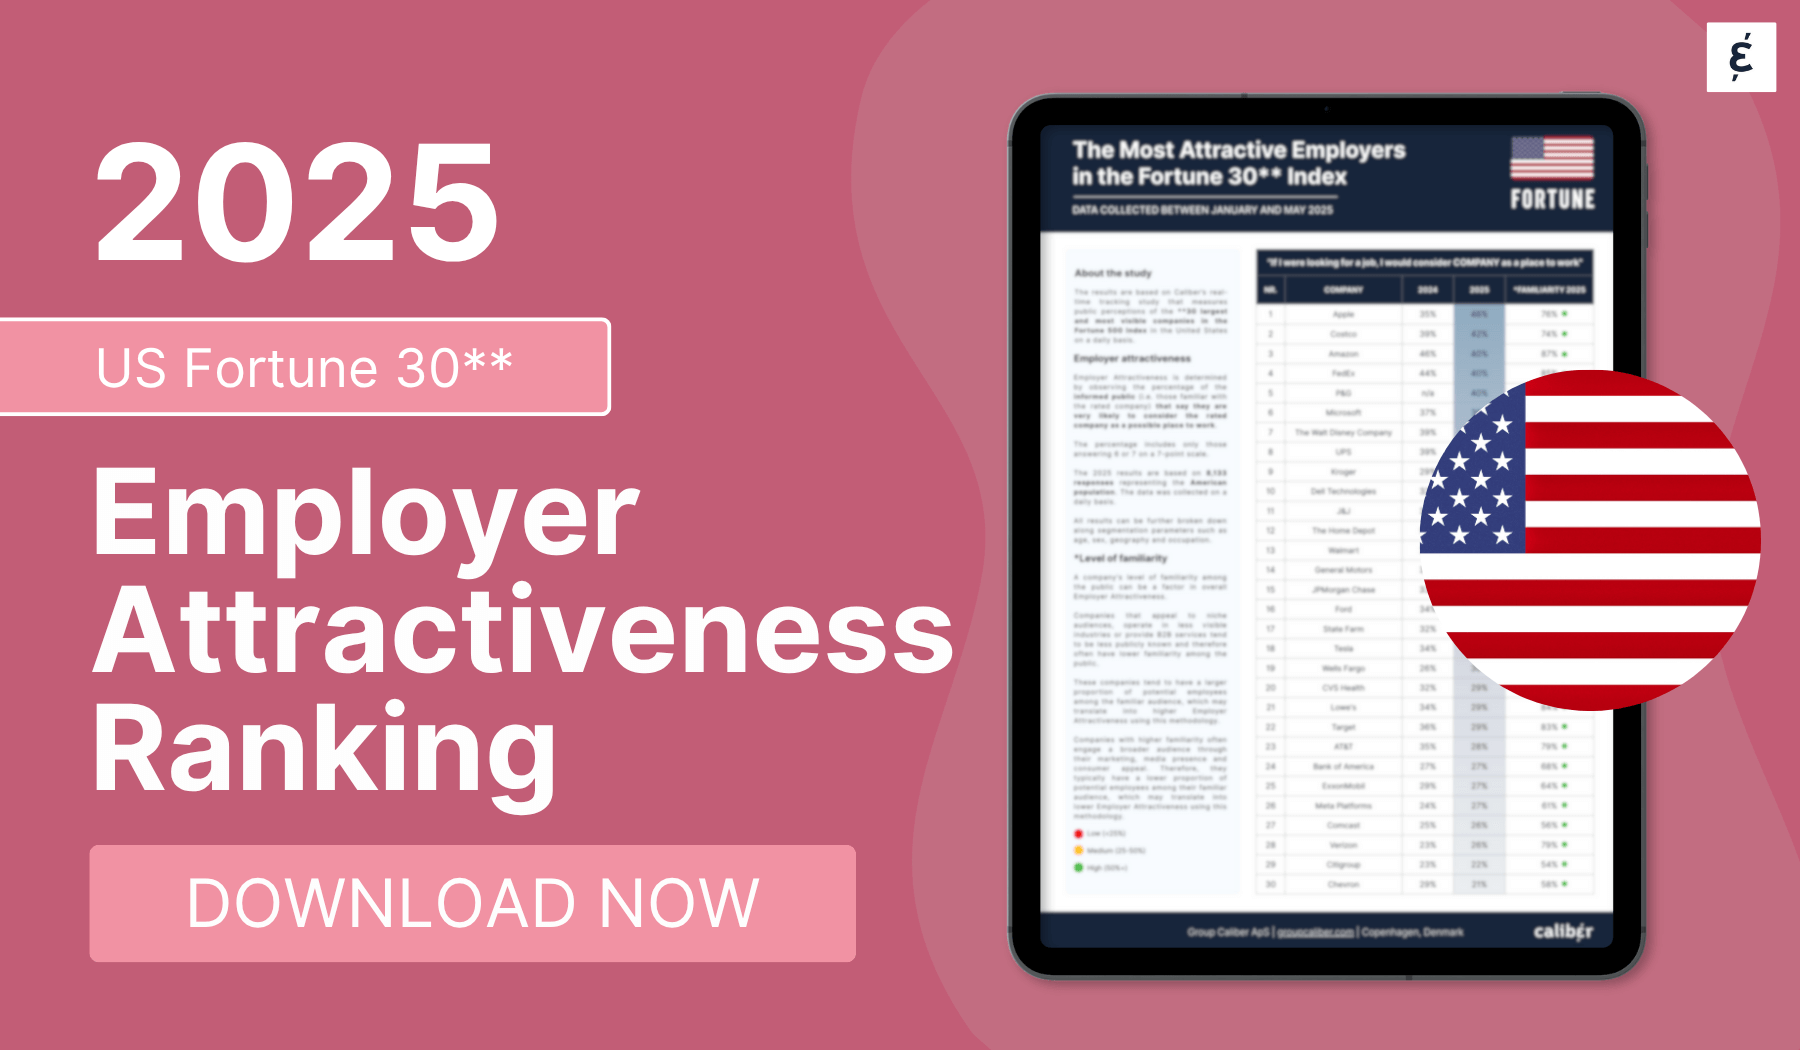
Apple ranked first in Caliber’s 2025 US Fortune 30 Employer Attractiveness ranking, with 46% of the informed public saying they would very likely consider working there.
How often does Caliber update its US rankings?
The Trust & Like Score ranking is published annually in the first quarter, and the Employer Attractiveness ranking is published in the third quarter, both reflecting continuous daily tracking rather than a single survey.
What is the difference between corporate reputation and employer attractiveness?
Corporate reputation, measured by the Trust & Like Score, reflects how much the public trusts and likes a company overall. Employer attractiveness measures a narrower question: whether people would want to work there. A company can score well on one and not the other.
Discover other rankings of Top Companies in the US