Caliber’s multi-source data integration connects continuous stakeholder survey data with media monitoring, stock market data, AI sentiment, your logged activities, and your own documents and KPIs, in one platform. Seeing them on the same timeline shows how perception moved and what moved with it.
Reputation data rarely lives in one place. Survey results sit in one report, media coverage in a monitoring tool, share price in a finance system, and campaign plans in a shared drive. Each tells part of the story, and none can explain on its own why perception shifted.
Multi-source data integration brings those signals together. This guide explains why a single data source leaves gaps, which sources Caliber can connect, how the data comes together on one timeline and in Sherlock, Caliber’s AI assistant, and how communications, investor relations, brand, and insights teams use a connected view.
Why is it so hard to see the full picture of your reputation?
It’s hard to see the full picture because every data source captures only one part of reputation. Surveys show what stakeholders think, media shows what’s being said, markets show how investors act, and your own records show what you did. Without multi-source data integration, connecting them takes manual work and guesswork.
Why does each data source tell only part of the story?
Each source answers a different question:
- Stakeholder surveys show what people actually think and feel about your company, and what they’re likely to do.
- Media monitoring shows what’s being said about you, how often, and in what tone.
- Stock market data shows how investors are acting on what they know.
- Your activities show what your company did and when, from launches to announcements.
- AI sentiment shows how generative AI tools describe your company to the people who ask them.
On their own, each source leaves the obvious follow-up question unanswered. A drop in trust raises the question of what happened. A spike in negative coverage raises the question of whether anyone’s opinion changed. Multi-source data integration puts the answers next to each other.
What happens when data lives in separate tools?
When data lives in separate tools, teams spend their time matching it up. Different reports cover different periods, use different definitions, and land on different days. Someone builds a spreadsheet to line them up, and by the time it’s done, the moment to act has often passed.
Separate tools also produce conflicting stories. The media team reports a strong quarter based on coverage, while the survey data shows trust slipping among investors. Without multi-source data integration, leadership has to decide which report to believe.
Why isn’t media and social data enough on its own?
Media and social data capture what’s said, which isn’t always what stakeholders believe. Coverage can be loud and still leave opinions unchanged, and perception can shift without any change in coverage, through word of mouth, customer experience, or events outside the news cycle.
That’s why media data is most useful next to direct measurement of stakeholder perception. Caliber integrates with leading media monitoring providers as partners, so their coverage data and Caliber’s perception data can be read together.
What is Caliber’s multi-source data integration?
Caliber’s multi-source data integration is the platform’s ability to combine continuous stakeholder survey data with external and internal data sources, on the same timeline and inside Sherlock. It’s modular by design: you connect the sources that matter to your business questions, and add more as your needs grow.
Survey data is the foundation of every Caliber setup, collected daily from the stakeholder groups you track in Stakeholder 360. Other sources are added through Caliber’s integrations, enabled by your Customer Success Manager.
Which data sources can you connect?
Depending on your subscription and setup, Caliber can connect:
- Media monitoring data, such as media volume, sentiment, exposure, and key articles and mentions.
- Stock market data, for comparing perception trends with share price and other market indicators.
- My Activities, where you log events and campaigns on the same timeline as your perception data.
- AI Impact data, showing how generative AI tools describe your company and how people who use AI to look you up perceive you.
- Context module data, with industry, country, and global indices from Caliber’s syndicated tracking.
- Your own documents, such as annual reports, strategy documents, and campaign briefs.
- Your own data, such as KPIs, social media exposure data, and results from your own studies.
- Custom integrations, for other data sources, available on request.
Which media monitoring providers does Caliber integrate with?
Caliber integrates with a range of media intelligence providers: Polecat, Polecat X, Meltwater, Cision, Digimind, Onclusive, Ecostampa, Data Stampa, MIMESI, and Altura Labs. Several were added in 2026 to support clients in the Italian market, and additional providers are available on request.
If you already use one of these providers, your existing coverage data can appear next to your perception data. Depending on the provider, the metrics include media volume, sentiment, exposure, and key articles and mentions.
Can you get Caliber data into your own systems?
Yes. Caliber’s API lets you receive data in real time, store it in your own databases, and visualize it in your own dashboards. Data can also be exported to CSV. Multi-source data integration works in both directions, so perception data can join the other data your organization already reports on.
How does multi-source data integration work?
Multi-source data integration works by bringing Caliber’s survey data and your connected sources into one data warehouse, which feeds both the Caliber platform and Sherlock. Connected data appears as layers on the same timeline as your perception metrics, and Sherlock can reference every connected source when answering questions.
How does the data come together?
Caliber’s survey data and external data, such as media monitoring and other connected sources, land in the Caliber Data Warehouse. From there, the data serves two places: the Caliber platform, where you see it in dashboards and charts, and Sherlock, where you can ask questions about it in plain language.
Because everything sits in one place, the sources share the same timeline, the same periods, and the same filters. A week of media sentiment lines up with the same week of survey data, with no manual matching.
What does it look like on one timeline?
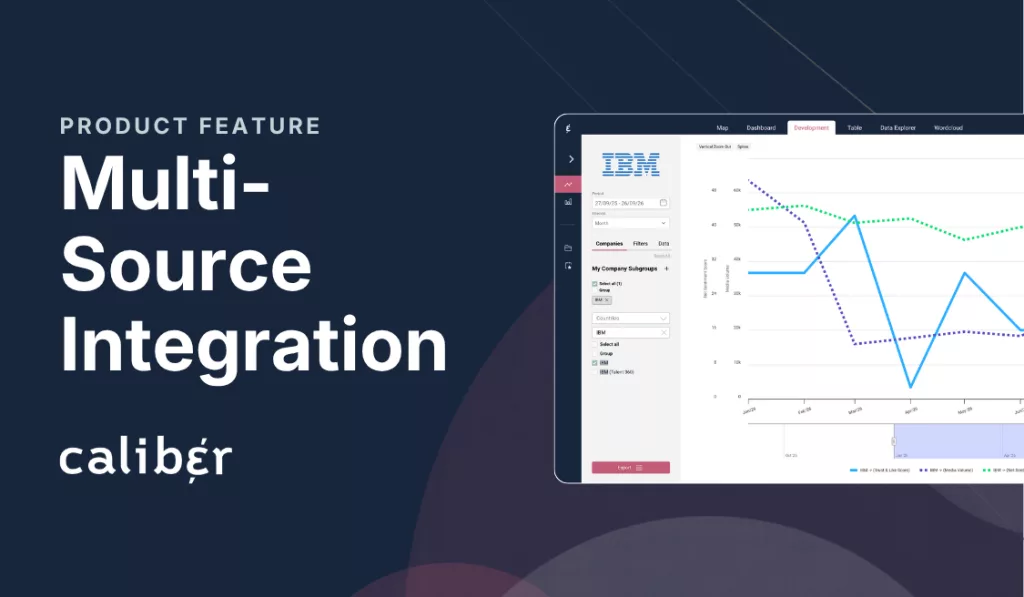
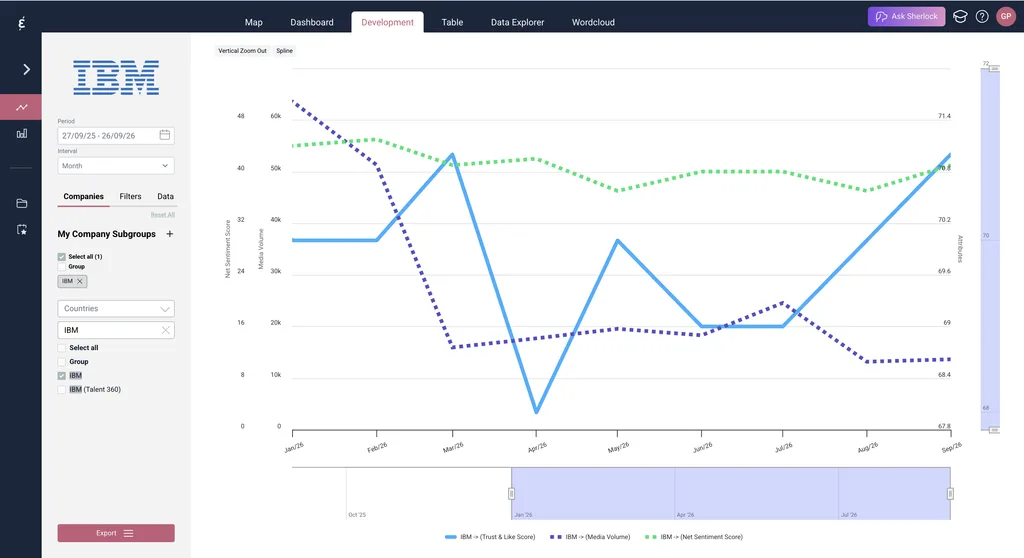
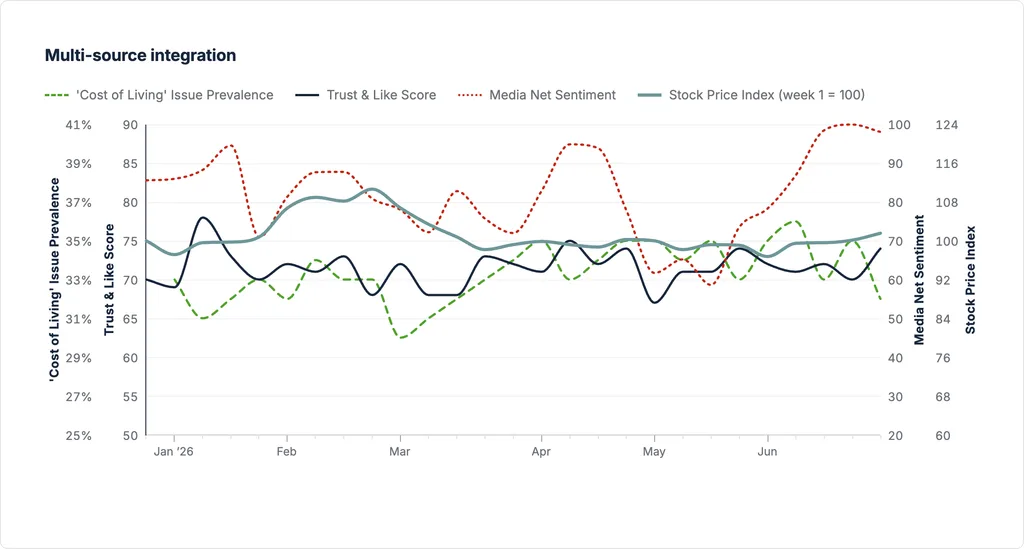
In the Development view, connected sources stack up as layers on a single chart. A fully connected view builds up like this:
- Perception: your Trust & Like Score and familiarity, tracked daily.
- Activities: your key events and campaigns, marked on the timeline from My Activities.
- Media: media volume and sentiment from your integrated provider.
- Market: your share price over the same period.
- AI: how generative AI tools describe your company.
Seen together, the layers show what happened around each shift in perception. The Trust & Like Score (TLS) is Caliber’s headline measure, the average of how much stakeholders trust and like a company, so it’s usually the first layer teams read against the others.
How does Sherlock use multiple sources?
Sherlock can reference every source connected to your account. That includes Caliber’s survey data and knowledge base, media monitoring integrations, Context module data, My Activities, documents and data you upload, and a curated set of third-party sources such as industry news, company websites, investor materials, and regulatory filings.
That lets you ask questions that cross sources, such as how coverage of a product launch lined up with trust among customers. Sherlock highlights notable changes, flags whether they’re statistically significant, and provides links to source material so you can check its answers. Read more about Sherlock, Caliber’s AI assistant.
How do you set up multi-source data integration, step by step?
- Start with your business questions. Decide what you need to explain, and which KPIs your leadership evaluates you on. That tells you which data sources belong in your setup.
- Choose your sources. Pick the sources that answer those questions, such as media data for communications teams or share price for investor relations.
- Connect them through Customer Success. Your Customer Success Manager enables integrations, whether that’s a partner provider or an existing data feed you already use.
- Add your own material. Log events and campaigns in My Activities, and upload documents and data to My Files or directly into a Sherlock session.
- Read the layers together. Open the Development view to see connected sources on one timeline, and ask Sherlock to explain what moved.
- Share the results. Use the API or CSV export to bring perception data into your own dashboards and reports.
Is your data secure when you connect it?
Yes. Caliber’s platform and Sherlock are hosted in the EU, with encryption in transit and at rest and role-based access controls. Documents and data you upload are not used to train or fine-tune the underlying AI model. Clients stay in control of what they upload, and special-category personal data must not be uploaded.
Does connecting data prove what caused a change?
Multi-source data integration shows which signals moved together. It doesn’t prove what caused a change. If trust fell in the same week that negative coverage spiked, the coverage is a likely explanation, but other events may have played a part too. Sherlock surfaces correlations based on timing and sentiment, and doesn’t perform causal analysis.
The more sources that line up, the stronger the case. A shift in perception that matches the timing of an event, a change in coverage, and a move in the share price is far more convincing than any one signal alone.
What does multi-source data integration include at a glance?
Here’s every data source Caliber can connect, and what each one adds to your view of reputation.
| Data source | What it adds |
|---|---|
| Stakeholder survey data | Continuous daily interviews, the core of every Caliber setup |
| Media monitoring | PolecatPolecat XMeltwaterCisionDigimindOnclusiveEcostampaData StampaMIMESIAltura Labs |
| Stock market data | Share price and other market indicators, compared with perception over time |
| My Activities | Events and campaigns logged on the same timeline as perception data |
| AI Impact | How generative AI tools describe your company, next to how people see you |
| Context module | Industry, country, and global indices from Caliber’s syndicated tracking |
| Your documents | Annual reports, strategy documents, and campaign briefs, uploaded to My Files or Sherlock |
| Your data | KPIs, social media exposure data, and results from your own studies |
| Custom integrations | Other data sources, available on request |
| Sherlock | Answers questions across connected sources, with links to the source material |
| API and export | Real-time API into your own databases and dashboards, plus CSV export |
| Security | EU hosting, encryption in transit and at rest, and uploads never used to train models |
| Setup | Modular by design: each source is added as you need it, through Customer Success |
What does multi-source data integration look like in practice?
In practice, multi-source data integration turns separate reports into one connected view. Airbus correlates its perception data with media monitoring through an API, and connected sources help teams see what happens when signals agree, and what it means when they don’t.
How does Airbus connect media data to perception?
Airbus tracks perception of itself and five competitors daily across 11 countries. Its perception data is correlated with media monitoring through an API integration, to connect communications output with impact. The data is also cross-referenced with the company’s events and campaigns.
Alerts warn platform users of sudden changes in perception, so the teams can check what else moved at the same time. The connected view feeds monthly management reports, quarterly and annual reviews with the Brand Committee, and annual KPIs for the communications and brand teams.
What happens when data sources disagree?
Disagreement between sources is often the most useful signal. Two patterns come up again and again:
- Coverage moves, perception doesn’t. A spike in negative media coverage with no change in trust suggests the story didn’t reach your stakeholders, or didn’t change their minds. That can save a company from overreacting.
- Perception moves, coverage doesn’t. A drop in trust with no change in media coverage points somewhere else, such as customer experience, word of mouth, or a sector-wide shift. Caliber’s global context data and Touchpoints view help narrow it down.
Without multi-source data integration, both patterns are invisible, because each team only sees its own data.
How does AI sentiment compare with human trust?
AI sentiment is one of the newest sources Caliber can connect, and it doesn’t always match what people think. Our analysis of AI sentiment versus human trust, using Coca-Cola as a case, compares what AI tools say about a company with how people actually feel about it. For a wider view, read whether AI is really shaping corporate reputation.
How do teams benefit from multi-source data integration?
Teams benefit from multi-source data integration because it replaces separate reports with one shared view of reputation. Corporate communications, investor relations, brand and marketing, and insights teams each connect the sources closest to their work, and read them against how stakeholders actually see the company.
How do corporate communications teams use it?
Corporate communications teams use multi-source data integration to connect output with outcome. Media coverage shows what the team achieved in the press, and perception data shows whether stakeholders’ views changed as a result.
Together with My Activities, that gives a complete record of each campaign or announcement, from the coverage it earned to the change in trust. Our guide to PR measurement shows how to use that record step by step.
How do investor relations teams use it?
Investor relations teams use stock market data alongside investor perception. Seeing share price and trust among investors on the same timeline shows whether a market move reflects a change in how investors see the company, or something wider in the market.
Uploaded annual reports and results announcements add further context, so Sherlock can reference what the company said when answering questions about how investors responded.
How do brand and marketing teams use it?
Brand and marketing teams upload campaign briefs, KPIs, and social media exposure data, and read them against awareness, familiarity, and perception attributes. That shows whether a campaign reached the audiences it was built for, and which activities lined up with gains.
AI Impact data adds a newer layer, showing how generative AI tools describe the brand to the growing number of people who use them to research companies.
How do insights and analytics teams use it?
Insights and analytics teams use multi-source data integration to stop matching data by hand. Connected sources share the same timeline and filters, so the work shifts from building spreadsheets to interpreting results.
The API brings Caliber data into the organization’s own dashboards and business intelligence tools, so perception data sits next to the other metrics the business already tracks.
How can Caliber support your multi-source data integration?
Caliber supports multi-source data integration with continuous stakeholder survey data at its core, and a modular set of integrations around it: media monitoring, stock market data, AI sentiment, activities, your own documents and data, and custom sources on request. Sherlock then answers questions across all of them.
A connected view answers the question every separate report leaves open: what moved with it? Answering it takes perception data collected continuously and measured consistently, joined with the other signals your organization already watches.
Stakeholder 360 is built for this work. It provides:
- Continuous survey data from the stakeholder groups you track, as the foundation
- Integrations with media monitoring providers including Polecat, Meltwater, Cision, Digimind, and Onclusive
- Stock market data alongside perception
- My Activities, for events and campaigns on the same timeline
- AI Impact data, for how generative AI describes your company
- Uploads for your own documents, KPIs, and data
- Sherlock, which can reference every connected source
- A real-time API and CSV export, to bring perception data into your own systems
See the full list of Caliber integrations, read our guide to benchmarking against competitors, or see how Caliber’s customers use their data.
Book a demo to see your reputation data connected in one view.