Caliber makes PR measurement about outcomes. Its My Activities feature puts every campaign on the same timeline as daily stakeholder perception data, so you can set a baseline, log the activity, and compare how awareness, trust, and intent moved among target audiences, against competitors, with built-in significance checks.
Most PR measurement still counts what a team produced: stories placed, reach, and impressions. Those numbers prove activity. They can’t show whether the people you set out to reach now see your company differently, and that’s the question a CEO or board asks after a campaign.
This guide explains what good PR measurement looks like and why the usual metrics fall short. It then shows, step by step, how Caliber’s My Activities feature connects communications activity to stakeholder perception, how to read the results honestly, and how different communications teams use them.
What is PR measurement, and why is it so hard to get right?
PR measurement is the process of evaluating what communications activity achieved, from the coverage it earned to the change it created in how stakeholders see a company. It’s hard to get right because the metrics teams track most easily, such as coverage and reach, sit furthest from the outcomes leadership cares about.
What do most PR teams measure today?
Most PR teams measure output. Muck Rack’s State of PR Measurement 2025 surveyed more than 800 communications professionals. 86% track the number of stories placed and 79% track reach or impressions, while only 17% track revenue impact such as leads, sales, or pipeline. The same report found that 61% of PR professionals don’t follow formal frameworks such as the Barcelona Principles.
Output metrics are easy to collect, and they do show that a campaign ran. What they can’t show is whether anything changed in the minds of the audiences the campaign was meant to reach.
Why don’t CEOs trust PR metrics?
CEOs often don’t find PR metrics useful because those metrics rarely connect to business outcomes. In a 2023 study of UK-based B2B companies commissioned by Champion Communications, 82% of the CEOs surveyed said the metrics their CMO uses to demonstrate PR’s ROI aren’t useful to them.
The sample was small, 50 CEOs, but the gap it describes is familiar to most communications leaders. When PR measurement reports volume and reach, leadership is left to guess what the activity was worth.
What does good PR measurement look like?
Good PR measurement follows the industry’s own standard. AMEC’s Barcelona Principles 3.0 state that measurement and evaluation should identify outputs, outcomes, and potential impact, moving beyond simply counting outputs.
A useful way to apply that is to separate PR measurement into four layers:
- Outputs: what you put out, such as stories placed, reach, and share of voice.
- Outtakes: what audiences did with it, such as engagement, clicks, and site visits.
- Outcomes: what changed in their minds, such as awareness, familiarity, specific perceptions like Innovation or Integrity, and overall trust.
- Behavioral intent: what they’re now more likely to do, such as buy from you, recommend you, or apply for a job with you.
Coverage tells you the campaign happened. Outcomes tell you whether it changed anything.
Why does perception matter more than coverage?
Perception matters because it predicts behavior. Caliber’s Trust & Like Score (TLS) is the average of two statements, trust and like, scored from 0 to 100. According to Caliber’s 2024 data from its Global 7 country indices, 30% of respondents would consider buying from a company in the Average band (TLS 60 to 69). That rises to 47% for companies in the High band (70 to 79) and 76% in the Very High band (80 and above). Recommendation follows the same curve, rising from 26% to 45% to 74%.
That link is what lets PR measurement speak the language of the business. A campaign that lifts TLS among a target audience is moving that audience toward the behaviors the business cares about.
What is Caliber’s My Activities feature?
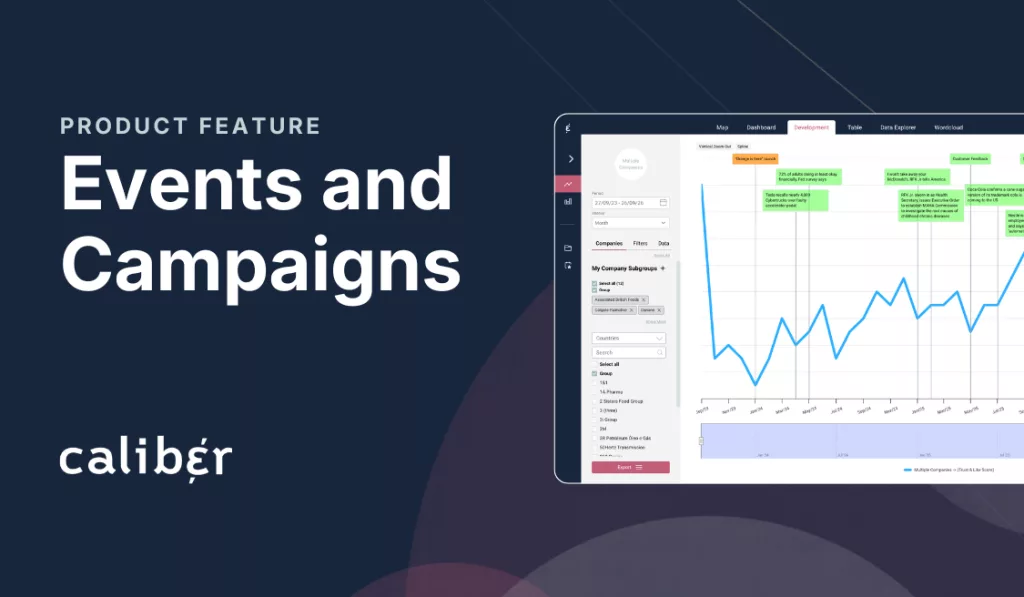
My Activities is a feature in Caliber’s Stakeholder 360 platform where you log events and campaigns on the same timeline as continuous stakeholder perception data. You log each launch, announcement, or campaign once, and it appears next to every metric you track, so PR measurement starts from what your audiences think.
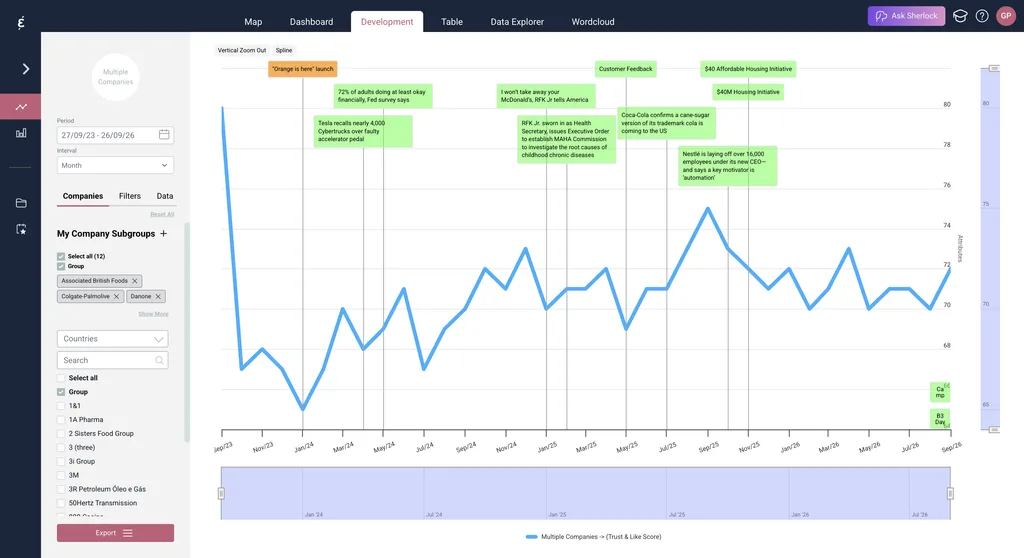
My Activities is part of Stakeholder 360. Once an activity is logged, it appears on the timeline of any metric you open, from TLS to awareness, familiarity, and individual perception attributes.
Because Caliber interviews stakeholders every day, the data around each activity is continuous. You can see perception before an activity, during it, and in the weeks after. You can compare the target audience with other groups and see whether competitors moved over the same period.
What’s the difference between an event and a campaign?
An event has a single date, and a campaign runs over a date range. Events cover moments such as a press release, product launch, financial report, or news story. Campaigns cover longer activity, such as a PR or advertising campaign, a conference, or a themed period.
On the timeline, events appear as point markers and campaigns as date ranges. That makes it easy to see at a glance whether a shift in perception lines up with a single moment or builds over a longer push.
What can you track with My Activities?
You can track any communications activity you want to evaluate, planned or unplanned:
- Custom categories: group activities by topic, media channel, importance, geography, or anything else. One activity can belong to several categories.
- Market linking: link each activity to specific countries, or set it to Global to cover every market you track.
- Shared records: activities are shared across your account, so every colleague works from the same record of what happened and when.
- Bulk upload: add many activities at once with a template, whether you’re planning ahead or backfilling past activity.
Unplanned events count too. A news story you didn’t plan can be logged the day it breaks, so your PR measurement also records the moments that tested you.
How is this different from a before-and-after survey?
A pre- and post-campaign survey gives you two data points, and continuous tracking gives you the whole line between them. Two snapshots are useful when that’s what the budget allows. The limitation is that campaigns run in a noisy world. News cycles, competitor moves, and shifts in the public mood all land in the same weeks, and two points can’t separate them.
With two points, you can’t see when a change started, whether it lasted, or whether competitors moved the same way. Continuous data shows perception before launch, the shape of any movement during the campaign, and whether it held afterward.
Continuous data also puts results in context. If trust in your whole sector dipped while your campaign was live, a flat score may be a win. Caliber’s Context module shows industry and country indices alongside your own data, so you can tell whether a change is about you, your industry, or the wider world.
How does PR measurement work with My Activities?
PR measurement with My Activities follows five steps: set a goal and audience, check the baseline, log the activity, compare the right periods and benchmarks, and check significance before interpreting. Because the data is continuous, the baseline already exists, and the results show how perception moved before, during, and after each campaign.
What are the five steps?
- Set the goal and the audience before launch. Decide which stakeholder group the campaign targets, which metric should move, and by how much. Barcelona Principles 3.0 treat setting goals as an essential prerequisite to planning, measurement, and evaluation.
- Check your baseline. With continuous tracking, the baseline already exists. Confirm that the target audience has enough responses to detect the change you’re aiming for. If it’s a small group, a sample boost adds interviews for that audience during the campaign period.
- Log the activity in My Activities. Add the campaign as a date range, or a launch or announcement as a single-date event, and link it to the right markets and categories. For a high-profile moment such as a trade show or summit, you can also run a quick poll with targeted questions about it.
- Compare the right periods and benchmarks. Compare the campaign period with the previous period of equal length. Add competitors or an industry index, and view the data at weekly intervals to see timing. Alerts flag sudden changes in perception while the campaign is live, so you can react before the final report.
- Check significance, then interpret. Confirm that the movement clears the significance threshold for your sample size. Then ask Sherlock, Caliber’s AI assistant, to surface correlations between your logged activities and perception shifts, and report the outcome against the goal you set in step one.
What data can you see alongside your activities?
Depending on your setup, the Development view can show your activities next to several other data sources:
- Media monitoring data, from integration partners such as Polecat, Meltwater, Cision, Digimind, and Onclusive, showing volume and sentiment next to perception.
- Stock market data, for comparing perception trends with share price.
- AI Impact data, showing how generative AI tools describe your company and how people who use AI to look you up perceive you.
The Table view highlights statistically significant results, so you can separate real movement from noise before reporting it. Media monitoring and other integrations are enabled through your Customer Success Manager.
Can PR measurement prove that a campaign caused a change?
PR measurement based on perception tracking shows correlation. It can’t prove causation on its own, because other things happen during any campaign. My Activities and Sherlock surface associations between your activities and perception shifts, based on timing, and don’t perform causal analysis.
You can still build a strong case. The evidence is most convincing when several signals line up:
- You set a clear goal in advance.
- The targeted audience moved while untargeted groups didn’t.
- Competitors stayed flat.
- The timing matches the campaign.
- Media data points the same way.
When those signals agree, the campaign is the most likely explanation for the change.
How many responses do you need to trust a change in perception?
Under Caliber’s significance rules, fewer than 100 responses gives a directional result only. Between 100 and 199 responses, a score change of four points or more is significant. From 300 responses, two points is enough, and from 700, a single point. Percentages need larger samples than scores to support the same size of change.
Narrow audiences need more data. A sample boost can close the gap for a specific audience or period. Otherwise, small segments need a longer window before the results support conclusions.
What does the method look like at a glance?
Here’s how PR measurement with My Activities works, from the activities you log to the significance rules that decide what counts as a real change.
| Feature | How it works |
|---|---|
| Events | A single date, such as a press release, product launch, financial report, or news story |
| Campaigns | A date range, such as a PR or advertising campaign, a conference, or a themed period |
| Tracking frequency | Continuous daily interviews, viewable by week, month, quarter, or year |
| Audiences | Configurable stakeholder segments, such as professionals, job seekers, customers, and custom audiences |
| Categories and markets | Custom categories, and activities linked to specific countries or to all markets |
| Period comparison | Rolling average for the selected period, compared with the previous period of equal length |
| Benchmarks | Competitors, 14 industry indices, and country indices |
| External data | Can integrate media monitoring, stock market, and AI Impact data |
| Alerts | Notifications when perception changes suddenly |
| Quick polls and sample boosts | Targeted questions about a specific activity, and extra interviews for a chosen audience or period |
| Sherlock | Surfaces correlations between logged activities and perception shifts |
| Significance | Under 100: directional only100 to 199: 4+ points300 to 699: 2+ points700+: 1+ point |
| Coverage | 6M+ interviews3,000+ companies monitored50+ countries |
| Data quality | Panel partners meet ESOMAR standards |
What does PR measurement look like in practice?
In practice, PR measurement with continuous tracking means perception data feeds directly into planning, reporting, and KPIs. Airbus, a global financial services company, and Demant each use it differently: across 11 countries, market by market, and through a corporate name change.
How does Airbus measure communications across 11 countries?
Airbus moved from periodic to continuous tracking in October 2021, to measure the impact of a new purpose-driven communications strategy. The setup tracks Airbus and five competitors daily across 11 countries. It combines Caliber’s standard brand and reputation model with questions on the purpose-driven strategy, plus custom filters for professionals, key opinion leaders, and talent in aerospace and defense.
The data feeds directly into how the teams work:
- Alerts warn platform users of sudden changes in perception.
- Media monitoring data sits alongside perception data through an API integration.
- Results go into monthly management reports, quarterly and annual reviews with the Brand Committee, and annual KPIs for the communications and brand teams.
- Around airshows and corporate summits, the team runs quick polls and sample boosts to learn which formats worked and plan future activity accordingly.
The work won four awards at the 2023 DataComms Awards in London, including Gold for Best use of data to assist reputation management.
“In an ever-changing world, the comms function needs broad, ongoing perception data to be able to seize opportunities and handle crises.”
Holger Schubert, Head of Brand and Corporate Image, Airbus
How did a global financial services company measure campaigns market by market?
A global financial services company needed to know how its campaigns performed market by market, among both business and consumer audiences. Caliber set up separate B2B and B2C dashboards and added market-specific questions to assess campaign performance and brand associations. Stakeholders were segmented by profession, responsibility, and experience.
Over six months, the tracking covered 2,100 interviews and five benchmark companies. A mid-term report let the company adjust course while campaigns were still running, rather than waiting for a final evaluation.
How did Demant track a corporate name change?
Demant, the hearing healthcare group, has tracked its perception with Caliber since January 2019. That was the year William Demant Holding A/S became Demant A/S under a new brand strategy. By comparing awareness and familiarity against historical data, segment by segment, the team could see how recognition of the new name developed among the public and its target audiences, and spot which activities lined up with gains in familiarity.
Later that year, the same tracking helped steer the company’s communication through a ransomware attack.
“The Caliber tracker is useful for planning communication ahead, deciding what topics are most important for us as a company.”
Trine Kromann-Mikkelsen, VP, Corporate Communications and Relations, Demant
How do communications teams benefit from My Activities?
Communications teams benefit from My Activities because it turns PR measurement into a shared, continuous record of what they did and how stakeholders responded. Corporate communications, brand and marketing, and regional teams each use that record to report, plan, and adjust.
How do corporate communications teams use it?
Corporate communications teams use My Activities to report campaign outcomes to leadership in terms of perception, alongside coverage figures. Logging planned activities during annual planning gives them a ready-made structure for quarterly reviews. It also makes it possible to set communications KPIs based on how target audiences respond.
When something unplanned happens, the same teams log the event the day it breaks and use alerts to catch sudden shifts early. Over time, that builds a record of which moments tested the company and how perception recovered.
How do brand and marketing teams use it?
Brand and marketing teams use it to follow launches, repositioning, and name changes as they land. Awareness and familiarity data by segment shows whether a new message is reaching the audiences it was designed for.
Comparing activity types over time shows which formats earn the strongest response. Around high-profile moments, quick polls add targeted questions, so the team learns what landed and plans the next activity accordingly.
How do regional and market teams use it?
Regional teams use market-level linking to see how the same global activity lands differently from one country to the next. A campaign that lifts perception in one market and leaves another flat is a signal worth acting on.
Local competitor benchmarks show whether a market moved on its own or with the whole sector. Our guide to benchmarking against competitors explains how to set those benchmarks up. Where a market or segment is small, sample boosts add the interviews needed to show a significant change.
How can Caliber support your PR measurement?
Caliber supports PR measurement with continuous, multi-stakeholder perception data and the tools to connect it to your activities. Stakeholder 360 and its My Activities feature show how the people who matter responded to each campaign, market by market, with significance built in.
Good PR measurement answers the question leadership actually asks: did the people who matter see us differently after this campaign? Answering it takes perception data collected before, during, and after the campaign, connected to a clear record of what the team did.
Stakeholder 360 is built for this work. It provides:
- Daily, always-on tracking of the distinct stakeholder groups your campaigns target, in one platform
- My Activities, for logging events and campaigns on the same timeline as your perception data
- Benchmarks against competitors, industry indices, and country indices
- Built-in significance rules
- Alerts that flag sudden shifts in perception while a campaign is live
- Quick polls and sample boosts for high-profile moments and small audiences
- The option to combine perception data with media monitoring and stock market data
- Sherlock, which surfaces the patterns so your team spends less time building charts and more time deciding what to do next
For the broader picture of reputation metrics, read our guide to how to measure brand reputation.
Book a demo to see how your next campaign would look in the data.