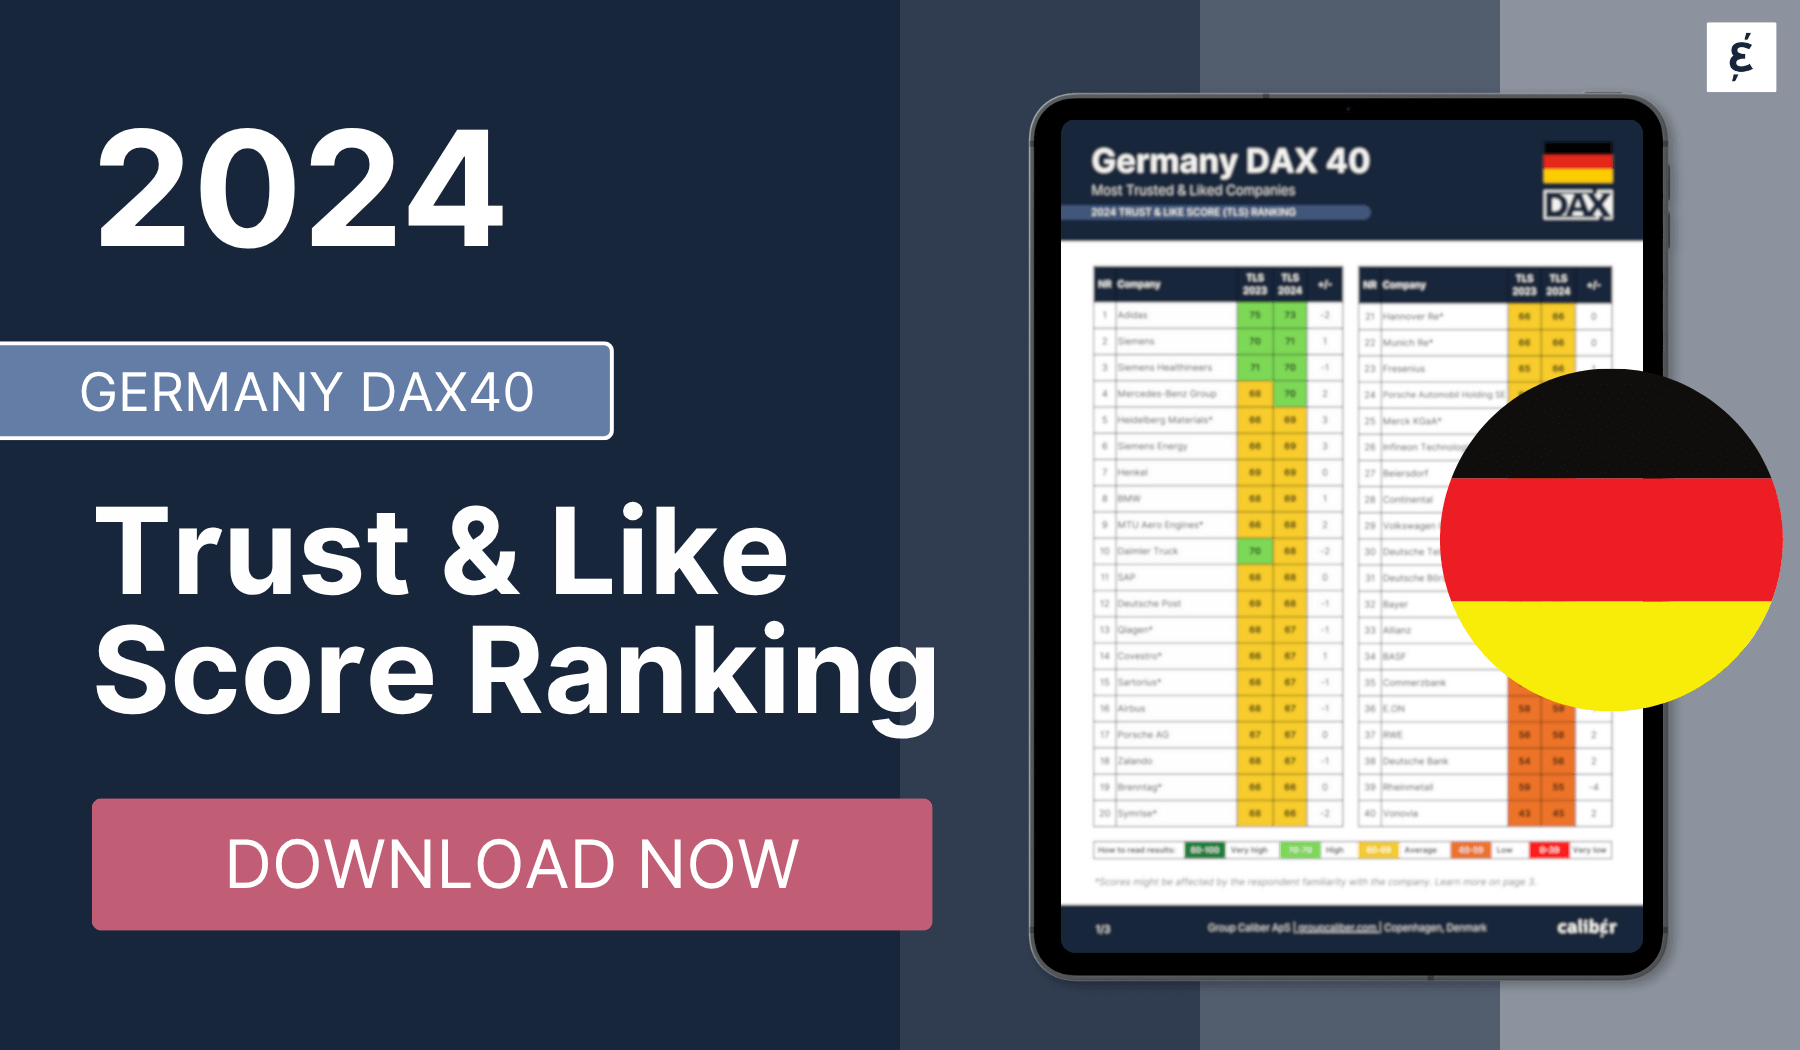

Trust is one of the strongest predictors of stakeholder behavior. It drives support in good times and protects reputation when companies come under pressure.
This ranking shows which of Germany’s largest listed companies lead on trust and likability in 2026. But this year, it goes further.
Download the full 2026 benchmark See the rankings, the volatility data, and what the relationship between trust, media, and share price reveals about reputation in 2026.
| Rank ⇅ | Company ⇅ | Familiarity ⇅ | TLS 2024 ⇅ | TLS 2025 ⇅ | +/- ⇅ |
|---|---|---|---|---|---|
| 1 | Siemens | 62% | 71 | 73 | ▲ +2 |
| 2 | Fresenius Med. Care | 15% | 69 | 72 | ▲ +3 |
| 3 | Siemens Energy | 29% | 69 | 72 | ▲ +3 |
| 4 | Siemens Healthineers | 22% | 70 | 72 | ▲ +2 |
| 5 | Adidas | 72% | 73 | 72 | ▼ -1 |
| 6 | Daimler Truck | 17% | 68 | 72 | ▲ +4 |
| 7 | Henkel | 50% | 69 | 70 | ▲ +1 |
| 8 | Airbus | 36% | 67 | 70 | ▲ +3 |
| 9 | Infineon Techn. | 19% | 65 | 69 | ▲ +4 |
| 10 | SAP | 32% | 68 | 69 | ▲ +1 |
| 11 | BMW | 68% | 69 | 69 | — 0 |
| 12 | DHL Group | 78% | 68 | 69 | ▲ +1 |
| 13 | Zalando | 61% | 67 | 69 | ▲ +2 |
| 14 | Fresenius | 20% | 66 | 68 | ▲ +2 |
| 15 | Continental | 40% | 65 | 68 | ▲ +3 |
| 16 | Porsche Aut. Hold. SE | 25% | 66 | 68 | ▲ +2 |
| 17 | Beiersdorf | 27% | 65 | 67 | ▲ +2 |
| 18 | Deutsche Börse | 19% | 63 | 67 | ▲ +4 |
| 19 | Mercedes-Benz Gr. | 47% | 70 | 67 | ▼ -3 |
| 20 | Bayer | 47% | 62 | 64 | ▲ +2 |
| 21 | BASF | 28% | 61 | 63 | ▲ +2 |
| 22 | Allianz | 59% | 62 | 63 | ▲ +1 |
| 23 | Deutsche Telekom | 72% | 64 | 62 | ▼ -2 |
| 24 | Volkswagen Group | 50% | 64 | 62 | ▼ -2 |
| 25 | Scout24 | 31% | n/a | 62 | n/a |
| 26 | Commerzbank | 51% | 61 | 61 | — 0 |
| 27 | E.ON | 54% | 59 | 61 | ▲ +2 |
| 28 | Rheinmetall | 29% | 55 | 60 | ▲ +5 |
| 29 | RWE | 35% | 58 | 59 | ▲ +1 |
| 30 | Deutsche Bank | 54% | 56 | 59 | ▲ +3 |
| 31 | Vonovia | 24% | 45 | 47 | ▲ +2 |
Familiarity is based on respondents who scored 4 or higher on a 7-point familiarity scale, after first demonstrating general awareness of the company. Companies where fewer than 15% of respondents met that threshold are listed separately, since the main ranking is designed to reflect general public opinion rather than industry-insider views — though many of these companies are well regarded among the customers, employees, and analysts who know them best.
| Rank ⇅ | Company ⇅ | Familiarity ⇅ | TLS 2024 ⇅ | TLS 2025 ⇅ | +/- ⇅ |
|---|---|---|---|---|---|
| 1 | GEA | 4% | 69 | 74 | ▲ +5 |
| 2 | Brenntag | 6% | 66 | 73 | ▲ +7 |
| 3 | Hannover Re | 7% | 66 | 73 | ▲ +7 |
| 4 | Heidelberg Materials | 7% | 69 | 72 | ▲ +3 |
| 5 | Qiagen | 5% | 67 | 72 | ▲ +5 |
| 6 | Symrise | 5% | 66 | 72 | ▲ +6 |
| 7 | MTU Aero Engines | 8% | 68 | 70 | ▲ +2 |
| 8 | Munich Re | 10% | 66 | 69 | ▲ +3 |
| 9 | Merck KGaA | 13% | 65 | 69 | ▲ +4 |






































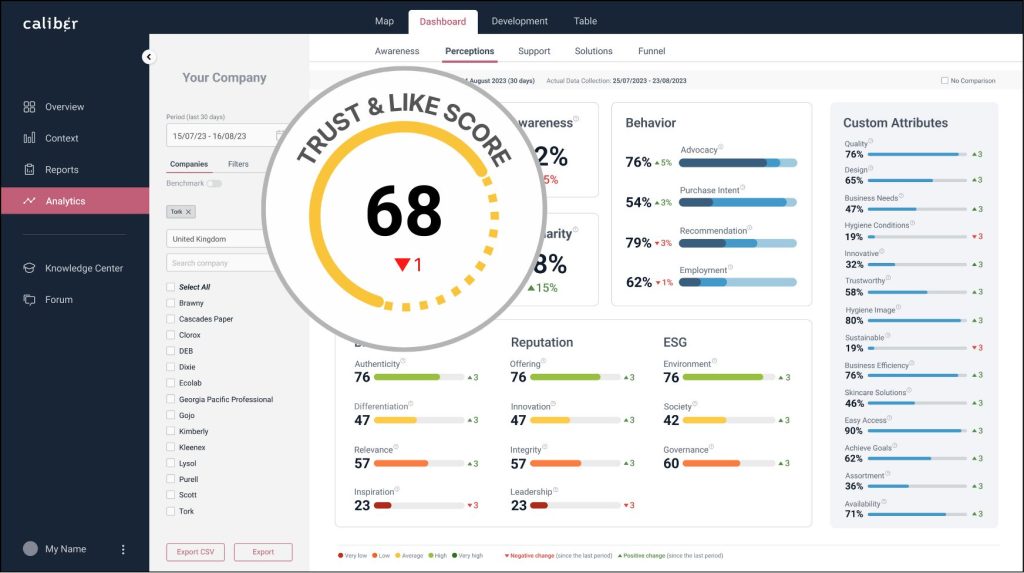
The Trust & Like Score (TLS) is Caliber’s core measure of stakeholder confidence. It combines two questions:
Trust: “Is this a company I trust?”
Likeability: “Is this a company I like?”
Together, these measures indicate which companies stakeholders are most likely to support and recommend—and which are better positioned to withstand scrutiny.
The TLS ranking is updated annually and is based on continuous measurement throughout the year, making it a stable benchmark rather than a one-off survey snapshot.
This chart shows the monthly average Trust & Like Score for the DAX 40 index from Jan–Dec 2025. Use it as a benchmark to see when the overall stakeholder confidence strengthened or weakened and which companies outperformed the index over time.

The ranking is the starting point. With Caliber, you can pinpoint what is driving trust and sentiment by:
stakeholder segment (customers, employees, investors, public)
topic drivers (leadership, ESG, products, governance, innovation)
time period (before/after key events)
competitive benchmarking across Germany and other markets
Fill out the form below to talk to our stakeholder intelligence experts